Isovalues/Isolines: options
Introduction
This section presents the different options associated to the calculation and tracing of isovalues in function of the used supports . There are two types of options:
- options of calculation (available upon creation)
- options of display (available after creation)
Calculation options
The calculation options are presented in the table below. The options are accessible in the Complements tab.
| Option | Definition | Comments |
|---|---|---|
| Force visibility | The user can choose to force the calculation visibility, as the visualization filters adjust themselves | |
| Leveling of the isovalues | The user can choose to level or not the color gradation of the calculated isovalues (by default, yes) | |
| Internal region or external region for the calculation |
If the tracing support is a volumetric region, the user calculates and visualizes the local quantity on the outline of the volume region. He can choose one of the following options:
|
only in 3D |
| Calculation on the internal faces of the regions | If the tracing support is the outline of volumetric region, the user can choose to calculate on the internal faces of the volume region (a volume can comprise internal faces which are necessary only for the geometry construction) | only in 3D |
| Type of calculation region | If the support for the tracing is Face, the type of the calculation region is necessary. This option is automatically found at the faces selection | only in 3D |
Displaying options
The displaying options are presented in the table below. The options are accessible, once the isolines/isovalues are computed and displayed, in the area of options to the right of the graphic zone.
| Option | Definition |
|---|---|
| Displaying mode Top/Bottom | If the tracing support is a face or a surface area, the calculation of the local quantity is carried out at either side of the face and the user can choose to visualize the local quantity at the top or bottom of the face. |
| Displaying mode Internal/External | If the tracing support is a volume region and the calculation of the local quantity is carried out on the internal and external faces of the region, the user can choose to visualize the local quantity on the internal or external faces of the region (see example below). |
| Displayed values |
The user can modify at will the minimal and maximal pins of the displayed values of the calculated isovalues/isolines:
|
| Color shade | The user has at his disposal various ranges of colors for the visual representation of the color shade. A cursor enable the user to adjust the number of color in order to improve the color shade. |
| Save/Charge the properties |
The user can record the graphic properties of the isovalues at an instant t by means of the Save properties button. He can then restore these graphic properties by the Charge properties button. |
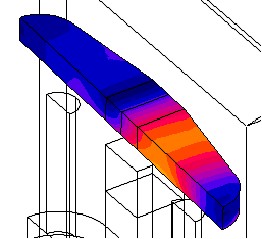
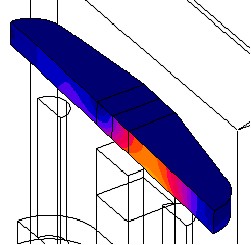
Example (tutorial of Magneto Static 3D)
The calculation was carried out on the internal and external faces of the volume region corresponding to the contactor blade.
|
Visualization on the internal faces (magnetic region) |
Visualization on the external faces (region air + symmetry plan) |
|---|---|
|
|
Options distribution / support
The table below presents the options available by the type of the used support:
| Volume region | Surface region | Face | |||
|---|---|---|---|---|---|
| Options | Internal or external region for the calculation | X | |||
| Calculation on the « internal faces » of the regions | X | ||||
| Displaying mode | Bottom/ Top | X | X | ||
| Internal/ External | X | ||||