Turbulent Mixing Layers in an Open Channel
In this application, AcuSolve is used to simulate the mixing of two streams of fluid with different velocities moving past a splitter plate. AcuSolve results are compared with experimental results as described in J. Delville, et al. (1989). The close agreement of AcuSolve results with the experimental results validates the ability of AcuSolve to model mixing layers in the turbulent flow regime.
Problem Description

Figure 1. Critical Dimensions and Parameters Used for Simulating the Turbulent Mixing Layer

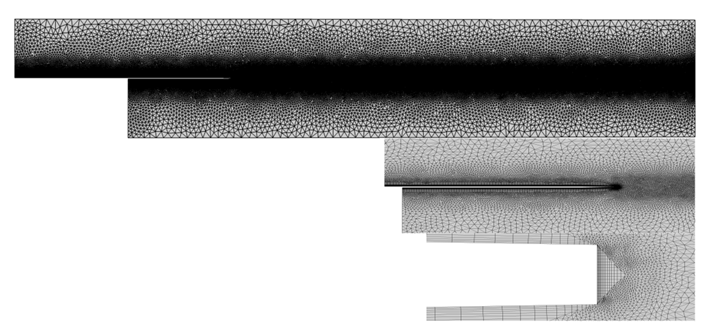
Figure 2. Mesh used for Simulating the Turbulent Mixing Layer Showing Close up Images Near the Trailing Edge of the Plate
The simulation was performed as a two dimensional problem by constructing a volume mesh that contains a single layer of elements extruded in the cross stream direction, normal to the flow plane and by imposing symmetry boundary conditions on the extruded planes. The upper and lower walls are specified as slip, the splitter plate is specified as no-slip and the inlet velocity and eddy viscosity are prescribed as constant values.
AcuSolve Results

Figure 3. Relative Velocity within the Channel Compared Against Experimental Data Showing Experimental and Simulated Results for the SA Turbulence Model

Figure 4. Velocity Magnitude Within the Channel
Summary
The AcuSolve solution compares well with experimental data for turbulent mixing within an open channel. In this application, the shear layer resulting from the dissimilar velocities of the incoming fluid streams results in an exchange of momentum within the channel. The amount of numerical dissipation from the grid is kept to a minimum to produce a good agreement with the experimental data. The good agreement with experimental results for the simulated turbulence model compares well with the measurement and previously published results, demonstrating that AcuSolve is capable of predicting turbulent mixing layers with relatively modest grid levels and the one equation turbulence model.
Simulation Settings for Turbulent Mixing Layers in an Open Channel
HyperWorks CFD database file: <your working directory>\mixing_layer_turbulent\mixing_layer_turbulent.hm
Global
- Problem Description
- Analysis type - Steady State
- Turbulence equation - Spalart Allmaras
- Auto Solution Strategy
- Max time steps - 100
- Convergence tolerance - 0.001
- Relaxation Factor- 0.4
- Material Model
- Air
- Type - Constant
- Density - 1.2 kg/m3
- Viscosity - 1.7189e-5 kg/m*sec
Model
- Air
- Volumes
- Volume
- Element Set
- Material model - Air
- Element Set
- Volume
- Surfaces
- Back
- Simple Boundary Condition
- Type- Symmetry
- Simple Boundary Condition
- Front
- Simple Boundary Condition
- Type- Symmetry
- Simple Boundary Condition
- InletLower
- Simple Boundary Condition
- Type- Inflow
- Inflow type- Velocity
- X Velocity- 22.4 m/sec
- Turbulence input type- Direct
- Eddy Viscosity- 0.0001432
- Simple Boundary Condition
- InletUpper
- Simple Boundary Condition
- Type- Inflow
- Inflow type- Velocity
- X Velocity- 41.54 m/sec
- Turbulence input type- Direct
- Eddy Viscosity- 0.0001432
- Simple Boundary Condition
- Outlet
- Simple Boundary Condition
- Type - Outflow
- Simple Boundary Condition
- Slip
- Simple Boundary Condition
- Type- Slip
- Simple Boundary Condition
- SplitterPlate
- Simple Boundary Condition
- Type - Wall
- Simple Boundary Condition
- TE
- Simple Boundary Condition
- Type- Wall
- Simple Boundary Condition
- Back
References
Delville, J., Bellin, S., Garem, J. H., and Bonnet J. P., "Analysis of Structures in a Turbulent, Plane Mixing Layer by Use of a Pseudo Flow Visualization Method Based on Hot-Wire Anemometry," in: Advances in Turbulence 2, eds: H.-H. Fernholz and H. E. Fiedler, Proceedings of the Second European Turbulence Conference, Berlin, Aug. 30-Sept. 2, 1988, Springer Verlag, Berlin, 1989, pp. 251-256.