Datum Lines
Allows you to add radial and phase datum lines to polar plots.
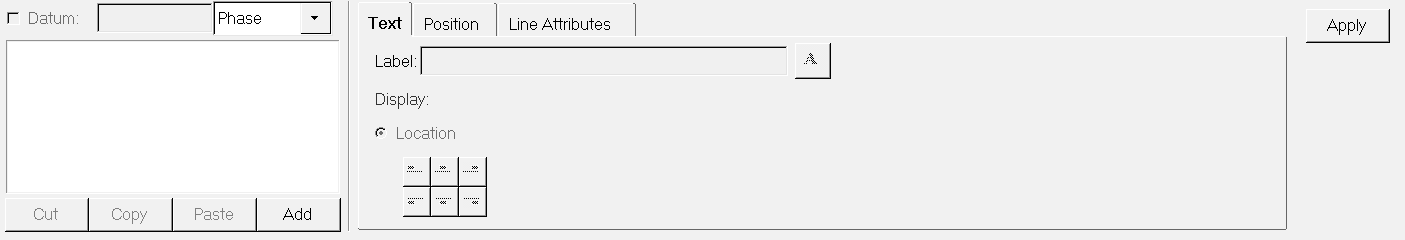
Figure 1.
Datum List
From the Datum list, you can select the datum line you want to modify.
A datum line can be hidden or displayed on a plot by activating the Datum check box.
Use the drop-down menu next to the Datum check box to switch between phase and radial datum lines.
You can cut, copy, paste or add datum lines to the list.
Text
Create a label for a datum line, select the datum line's location on the screen, and enter a math expression to define the datum line's location.
- Label
- Enter a datum line label in the Label field. Select the font button to change the font attributes.
- Location
- Select one of the location buttons to move that datum line to that location in the plot window. For magnitude datum lines, the buttons refer to the location in the plot window. For phase datum lines, the location buttons work similar to XY plots, placing the label with respect to the line.
Position
You can enter a single value or mathematical expression that returns a single value to position the datum line on the plot.
Line Attributes
From this tab, you can set the attributes of a datum line.
Click Use Preferences to use the preferences defined in the preferences.mvw file.