Build Plots
Constructs multiple curves and plots from a single data file.
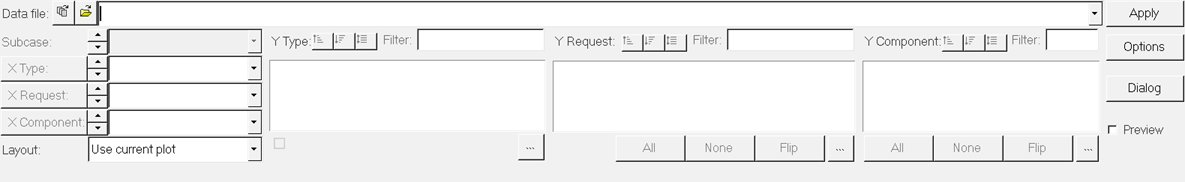
Figure 1.
- Subcase
- Select a subcase by using the
 buttons to scroll through the types of data
in the open file or clicking the down arrow to expand the list.
buttons to scroll through the types of data
in the open file or clicking the down arrow to expand the list. - X Type
- Y Type
- Select the data type for the X vectors.
- Data files can consist of different types of data. The available data
types depend on the data file. Use the buttons to scroll through the types of data
in the open file or click on the down arrow to expand the list.
- Or, click the X Type button to launch the X Type filter. This filter
contains the same selections as the drop-down menu, but allows you to
search for a specific request by entering a string and pressing Enter. Only the types that match the string are
displayed. The search request feature is case sensitive. To clear a
filter, remove the text from the field and press Enter.
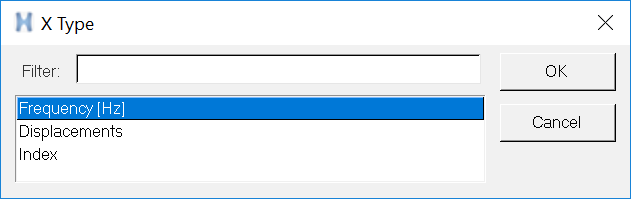
Figure 2. - Click the
 button to launch the Y Type dialog. If X
Type is set to Frequency, it creates a vector plot. If you specify the
data type other than the default, it creates a phase vs.magnitude
plot.
button to launch the Y Type dialog. If X
Type is set to Frequency, it creates a vector plot. If you specify the
data type other than the default, it creates a phase vs.magnitude
plot. - X Request
- Y Request
- Request Filter
- Once the data type has been selected, the data request set needs to be
selected. To do this, use the buttons to scroll through the requests or
click the down arrow to expand the list for X Request. Or, click the
button to launch the Y Request filter. This
filter contains the same selections as the Y Request list and the X
Request drop-down menu.
- X Component
- Y Component
- Component Filter
- To select the data component, use the buttons to scroll through the X
Component options or click the down arrow to expand the list. Or, click
the button to launch the Y Component dialog.
This dialog contains the same selections as the Y Component list and the
X Component drop-down menu.
- Sorting Type, Requests, and Components
- Click
 to sort the data in ascending order.
 - Click
 to sort the data in descending order.
 - Click
 to return the data list to its original
order.
to return the data list to its original
order.
Layout Options
Use the Layout menu to specify how the plotted data is arranged on the page.
- Field
- Description
- Use Current Plot
- Every curve is overlaid in the active window.
When one of the following options is selected, the page layout icon becomes available.
- One Plot Per Request
- Each selected request is plotted in a new plot with the corresponding
components overlaid.
For example, if two Y requests and four Y components are selected, two plots are created with four curves in each plot.
- One Plot Per Component
- Each selected component is plotted in a new plot with the corresponding
requests overlaid.
For example, if two Y requests and four Y components are selected, four plots are created with two curves in each plot.
- One Curve Per Plot
- Each curve is plotted in a new plot.
For all plotting options, a new page is created. The layout of the new page can be selected from the page layout button on Build Plots. When the plots are built, each window on the new page is filled. If more windows are required, another page of the same layout is created.
- Apply
- Click Apply to construct all the curves at
once.
The program automatically generates axis labels, plot titles, and page names. They can be edited using the Axes and Title panels and the Page List dialog.
Plots can contain up to six horizontal and six vertical axes. All curves created using Build Plots are automatically assigned to the primary horizontal and vertical axes.