Legends
Legends are automatically generated when a plot is built in the Build Plots panel, or in the Define Curves panel for bar charts.
Legends are displayed and positioned, and their attributes are specified in the
panel. Click the Legends icon, ![]() , to
display the panel. Or, from the menu bar, select .
, to
display the panel. Or, from the menu bar, select .
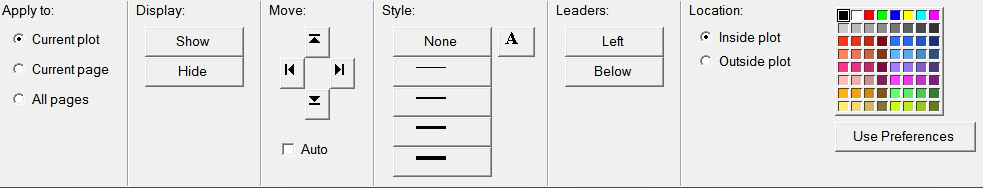
Figure 1. Legends panel
The curve legend displays the curve name and the line attributes that are assigned to the curve. The curve name and line attributes can be modified using the Define Curves panel. The order of the curves listed in the legend reflects the order of the curves as they appear in the curve list on the Define Curves panel. To change the order of the curves in the legend, switch to the Define Curves panel and using the Cut/Copy/Paste commands, re-order the names of the curves in the list.
Apply to
You can modify legends in the Current Plot, Current Page, or All Pages.
Display
Click Show to display a legend and Hide to hide a legend.
Move
You can pick a legend with the mouse and drag it to any position on the plot or use the move arrow buttons to position legends to the extreme right, left, top, or bottom of the plot.

- Moves the legend to the far left side of the current plot.

- Moves the legend to the far right side of the current plot.

- Moves the legend to the bottom of the current plot.

- Moves the legend to the top of the current plot.
- Auto
- When selected, HyperGraph 2D automatically moves the
legend when it obscures the curve display. HyperGraph 2D
tries to move the legend to the following locations, in the following
order:
- Upper left corner
- Upper right corner
- Lower left corner
- Lower right corner
Style
- None
- Click None for a borderless legend or click on a line thickness to add a border.

- Click the font button to select a font style and size for the selected legend.
Leaders
- Left
- Positions the leader to the left of the curve name within the legend.
- Below
- Positions the leader below the curve name within the legend.
Location
- Inside Plot
- Places the legend inside the plot area.
- Outside Plot
- Places the legend outside the plot area.
Pick a color from the color palette to change the color of the legend leader and text.
Use Preferences
Click to use the preferences set in the preferences.mvw file.