Optimization, RBDO - Display
Plot a Pareto or Anova plot for the Scanning DOE results.
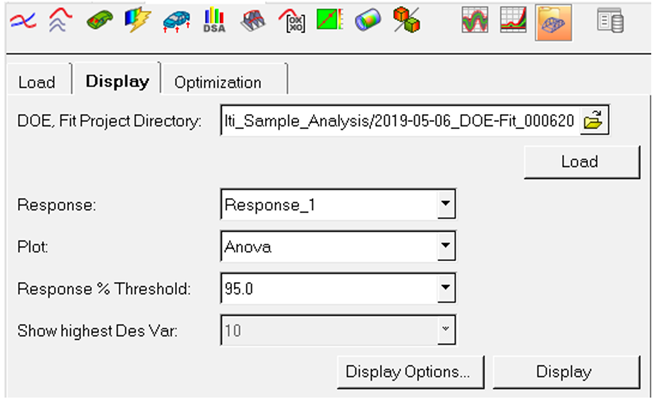
Figure 1.
- Response
- Select the response to study for Scanning DOE analysis.
- Plot
- Select the type of plot to study Scanning DOE results: Pareto or Anova.
- Response % Threshold
- Specifies the percent threshold to capture the response.
- Show highest Des var
- Show the highest number of sensitive variables.
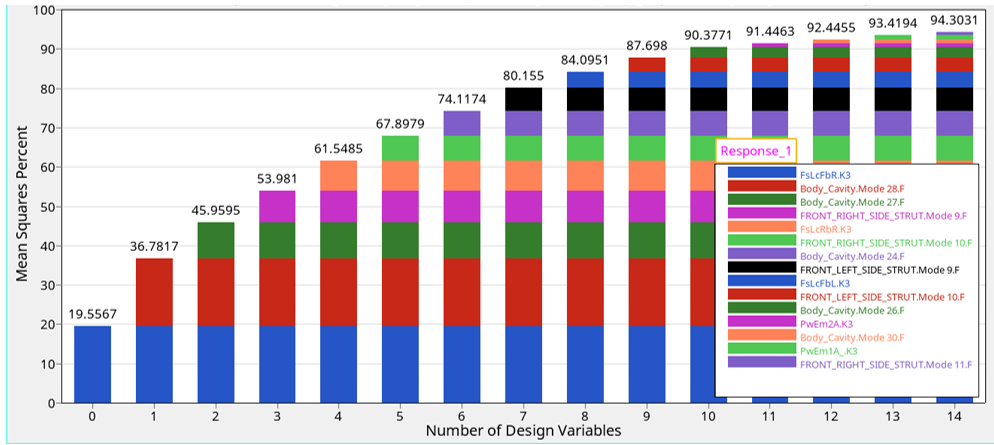
Figure 2.