Integrated Diagnostics
Calculate a response, perform contribution analysis, plot results, and perform diagnostic studies and study response changes.
- Calculate response based on sensitivity and forces (power train and road).
- Perform contribution analysis for responses calculated using sensitivity and forces.
- Plot and overlay response curves from an OptiStruct or Nastran punch file.
- Perform diagnostic studies using the diagnostic result from a solver or sensitivity.
- Perform study response changes.
Problem resolution in NVH is primarily about understanding the physical behavior of system dynamics. This is true with CAE as well as testing. A typical NVH diagnostic process flow and commonly used diagnostic results are shown here:
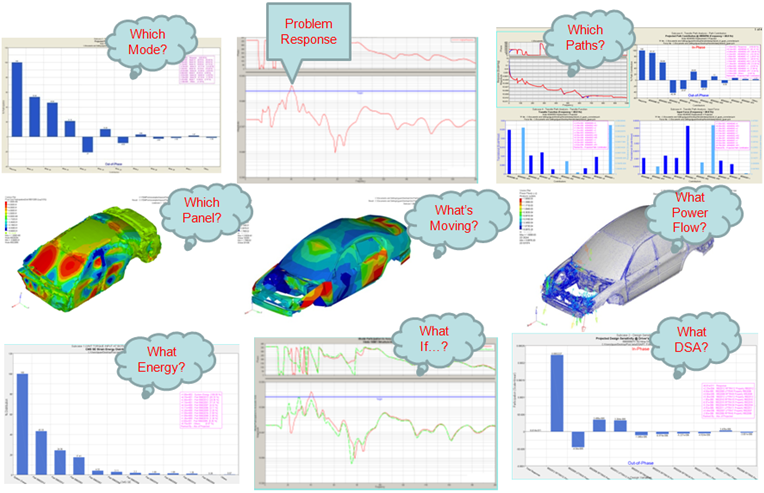
Figure 1. Typical NVH diagnostic process flow and results
The advantage in diagnosing an NVH problem using CAE is that a large amount of systems behavior data can be easily generated, which in many cases is difficult or impossible to obtain from hardware testing. In addition, CAE diagnostic results often represent mathematically derived cause and effect relationships to the related NVH responses, and therefore are more specific and effective in helping you identify solutions to your NVH problems.
Managing the large amount of CAE-generated diagnostic data can be complex and time consuming. The Integrated Diagnostics utility is designed to manage the various NVH diagnostic results and serve them based on user demands. This is accomplished by building connections between responses and their related diagnostic results, thereby automating NVH diagnostics. This allows you to focus on understanding the system dynamics and eliminate the data management burden.