Integrated Diagnostics - Diagnostics
After plotting the response(s), assign diagnostic results by invoking the Diagnostic Results dialog.
To do this, select a curve in the plot window, right-click, and select Diagnostic Results from the context sensitive menu. It is possible to perform diagnostic studies using the diagnostic result from solver or sensitivity
- Diagnostic results related to a particular response (response breakdown).
-
- Modal/panel participation.
- Grid participation.
- Transfer path participation.
- Design sensitivity.
- Diagnostic results related to a particular normal mode (characterization of modal behavior).
-
- Modal eigenvector animation and modal eigenvalue/frequency.
- Modal energy distribution.
- Diagnostic results related to an overall system response at an excitation frequency (characterization of system behavior).
-
- Operating deflection shape (frequency response animation).
- Energy distribution.
The fundamental focus of this utility is the concept of events. In the NVH field, events are typically related to standard tests that isolate NVH phenomenon to those caused by specific external inputs. Examples of NVH events include engine idle, engine wide open throttle (WOT), rough road at 30 MPH, or brake roughness.
In CAE simulation, each event is typically associated with one or more analysis subcase(s) in which system responses are calculated. In NVH, responses are typically driver or passenger touch or experience points, such as steering wheel vertical response, inboard seat track bolt response, or left ear sound pressure level, for example. In the Integrated Diagnostics utility, you are expected to associate response subcases to a particular event. Each response subcase can include multiple responses and directions. Each response direction can then be associated with a number of diagnostic results.
NVH problems are typically characterized by frequencies where a response is over the targeted value. As a result, you are often more interested in understanding the system behavior at these frequencies of interest, referred to as concern frequencies. To reduce the volume of diagnostic data, a common practice is to request a diagnostic request for diagnostic result output only at the concern frequencies of the respective response. The Diagnostic Results dialog of the Integrated Diagnostics utility captures the concern frequencies in a separate column.
- Response file
- In the Response file section, select a *.pch file.
- Response/Subcase Control 1
- The following fields are available under Response/Subcase. Once the
result selection options are complete, click Load
Response to further investigate the participations.
- Subcase
- Select an analysis subcase from the drop-down menu. Use the up and down arrow buttons to go to the next item in the list.
- Response
- Select the grid ID and component of the response from the drop-down menu. Use the up and down arrow buttons to go to the next item in the list.
- Scale
- The following options are available under Scale:
- Linear
- Plots the linear values.
- Logarithmic
- Plots the values in logarithmic scale. With this scale, data points are spread out more, which makes it easier to view.
- dB10
- 10 logarithmic of the participation value over the reference value.
- dB20
- 20 logarithmic of the participation value over the reference value. For acoustic responses, the reference pressure is 20E-12 MPa.
- Weighting
- A – A-weighting is used to define equal loudness sound pressure levels.
- Unit
- The Unit option allows you to display unit information in the axes labels. Place a check mark in the Unit box to enable this feature; remove it to disable this feature. The entity units are derived from unit sets for Time, Length and Force. For example, the acceleration is m/s2 if Time is set to seconds (s), Length is set to meters (m), and Force is set to Newtons (N).
- Plot layout
- Allows you to select how the plots are displayed in the window.
- Update current layout
- Current plot/layout is updated in the active window.
- Plot response in a new page
- The response is plotted into a new window on a new page.
- Copy current layout in new page
- Current plot/layout is copied and placed into a new window on a new page.
- Layout Definitions
- Save diagnostic layout for responses.
- Display
- Do not show phase - Hides the phase values on the plot.
- Concern frequency Information
- The concern frequencies are populated once diagnostic results are loaded.
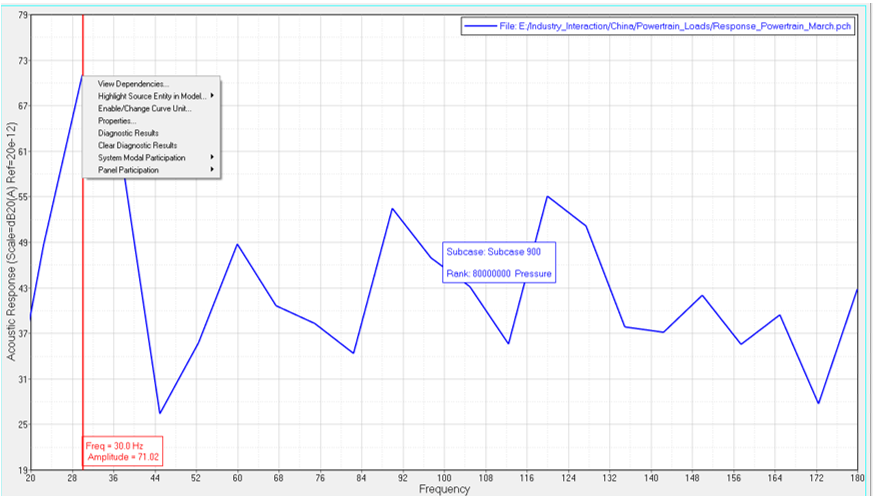
Figure 1. Context-sensitive menu
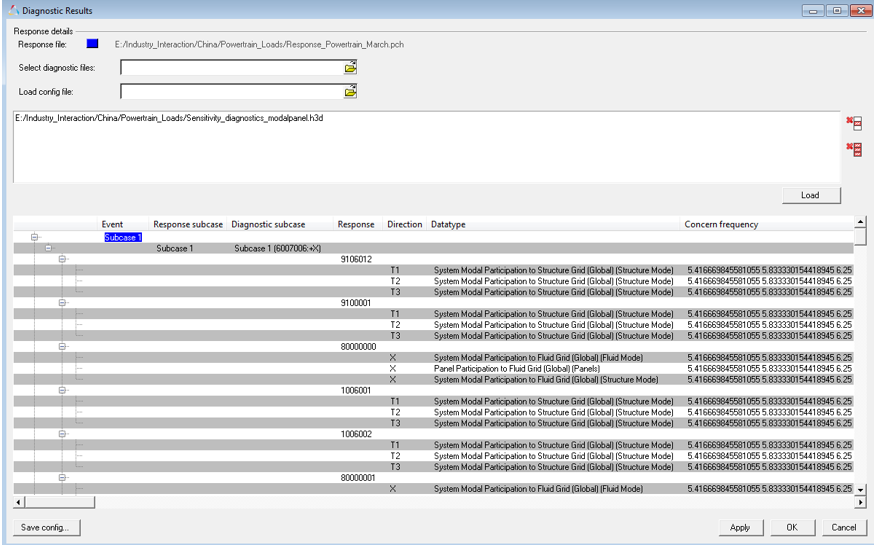
Figure 2. Diagnostic Results dialog
To customize the assignment of events, select all diagnostic subcases related to a particular event, right-click and select Assign To Event. The Event Details dialog is displayed:
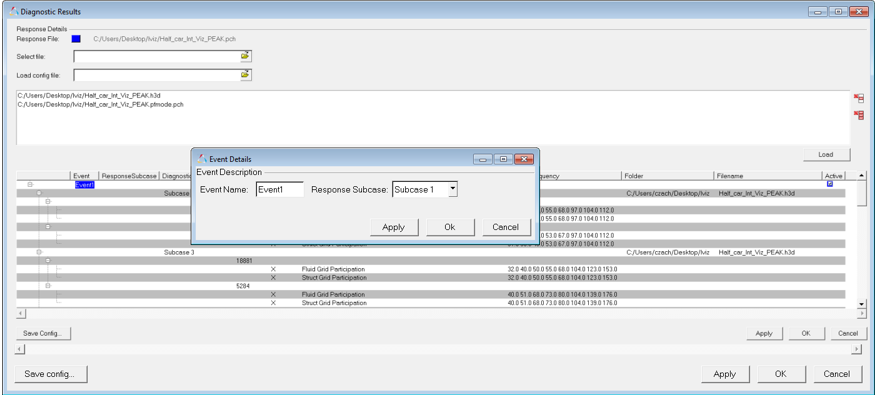
Figure 3. Event Details
Once the dialog has been opened, the following fields are displayed:
- Response File
- The file path of the selected response.
- Select file
- Click the file browser button to select one or more files containing valid diagnostic results. Currently, Modal/Panel Participation, Grid Participation, Transfer Path Analysis, Energy Distribution Analysis, Normal Modes Animation and Response Animation results are supported.
- Load config file
- Click the file browser button to select a configuration file saved from a previous session.
- Load
- Click Load to load diagnostic results from the selected files.
- Save Config...
- Click Save Config... to save your selections to a configuration file.
- Apply
- Click Apply to apply your selections.
- OK
- Click OK to to apply your selections to and exit the dialog.
- Cancel
- Click Cancel to cancel any edits made and close the dialog.
In the Event Details dialog, enter an Event Name and the corresponding Response Subcase to be linked to the selected diagnostic subcase and click OK. The linkage is then established and dynamic, right-click context-sensitive menus become available as shown below. You can select any of the diagnostic results available from the context-sensitive menu to instantly plot the results.
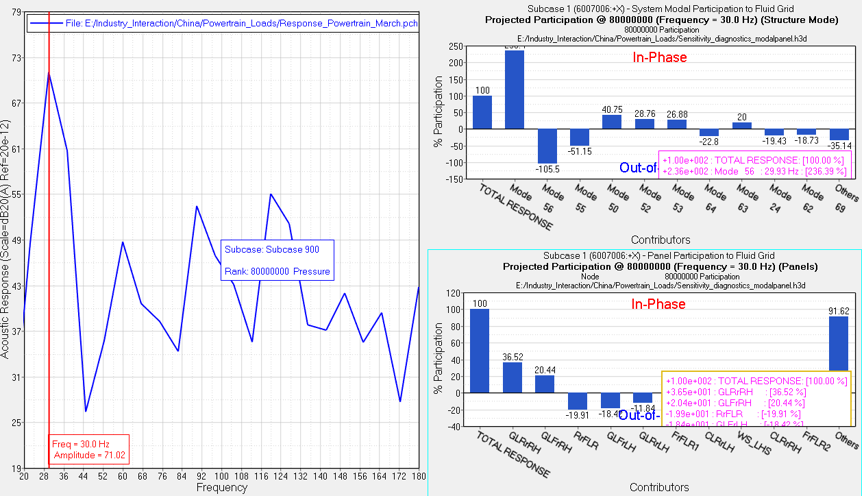
Figure 4. Integrated Diagnostics context-sensitive menu options