Integrated Diagnostics - Vehicle Response
Calculate and plot responses specific to loadcases, including general loadcases, power train input, and road profile input from an OptiStruct or Nastran Punch file.
- Contributions tab
- Use these options if the response is calculated with the sensitivity and force files loaded in the Loadcase Processing tab.
- Diagnostics tab
- Use the right-click context sensitive menu option in the plotted response. Perform diagnostic studies using the diagnostic result display capabilities.
You can overlay the results between different result files or within the same result file. Different result files for results overlay between them are loaded in the File Selection dialog, which is invoked by clicking the Vehicle Response Tab.
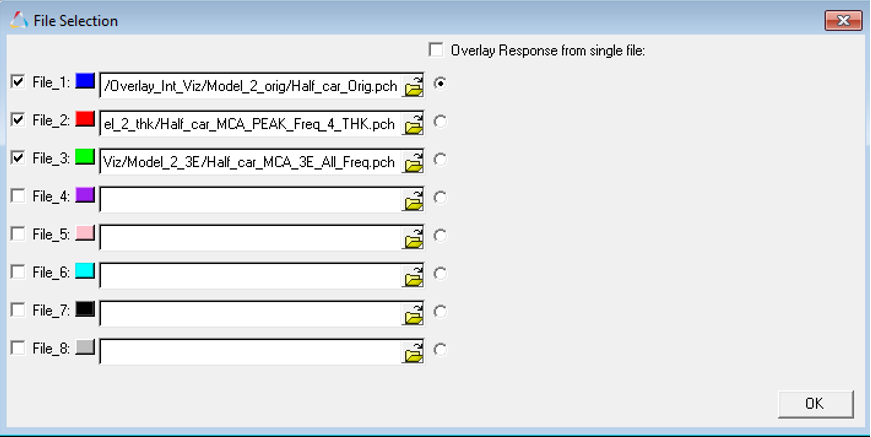
Figure 1. Response overlay between different result files
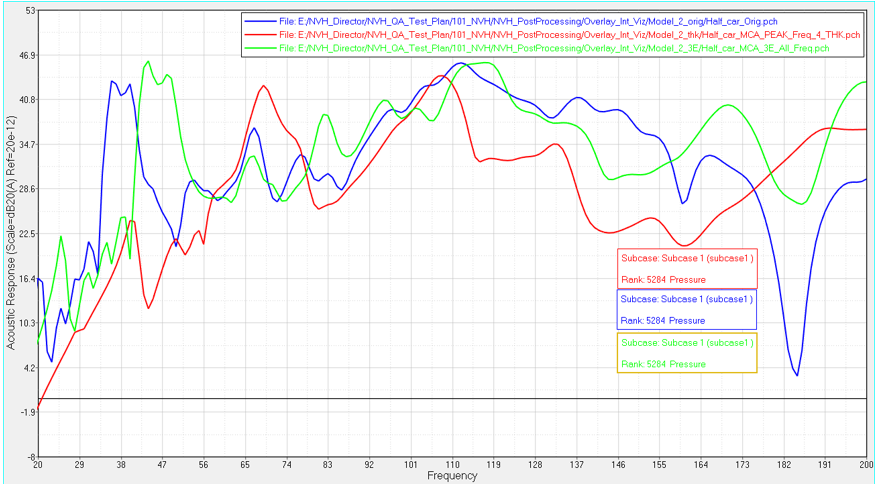
Figure 2. Different result files
Overlay results between the loaded result files in the File Selection dialog. To overlay results in the same result file, select the result file and select Overlay Response from single file. Then, you can select the combination of subcases and responses for the overlay.
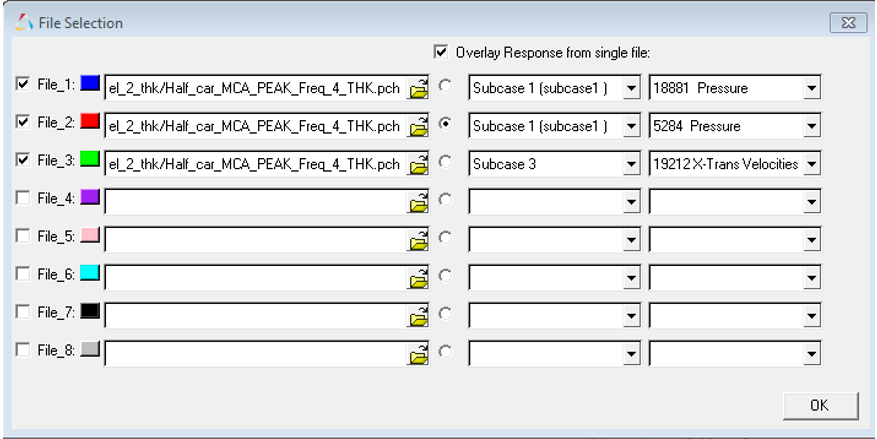
Figure 3. Response overlay in the same result files
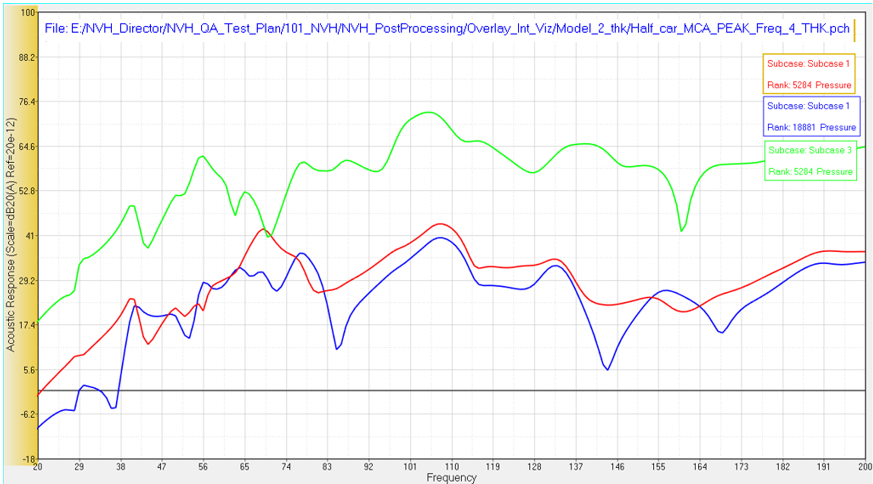
Figure 4. Same result files
- Response/Subcase Control 1 and Control 2
- The following fields are available under Response/Subcase. Once the
result selection options are complete, click Load
Response to further investigate the participations.
- Subcase
- Select an analysis subcase from the drop-down menu. Use the up and down arrow buttons to go to the next item in the list.
- Response
- Select the grid ID and component of the response from the drop-down menu. Use the up and down arrow buttons to go to the next item in the list.
- Scale
- The following options are available under Scale:
- Linear
- Plots the linear values.
- Logarithmic
- Plots the values in logarithmic scale. With this scale, data points are spread out, which makes it easier to view.
- dB10
- 10 logarithmic of the participation value over the reference value.
- dB20
- 20 logarithmic of the participation value over the reference value. For acoustic responses, the reference pressure is 20E-12 MPa.
- Weighting
- A – A-weighting is used to define equal loudness sound pressure levels.
- Unit
- The Unit option allows you to display unit information in the axes labels. Place a check mark in the Unit box to enable this feature; remove it to disable this feature. The entity units are derived from unit sets for Time, Length and Force. For example, the acceleration is m/s2 if Time is set to seconds (s), Length is set to meters (m), and Force is set to Newtons (N).
- Plot options
- Allows you to select how the plots are displayed in the window.
- Update current layout
- Current plot/layout is updated in the active window.
- Plot response in a new page
- The response is plotted into a new window on a new page.
- Display
- Do not show phase - Hides the phase values on the plot.
- Plot Result File
- Click on a numbered button to toggle the response display from the file. The plot line color matches the numbered button color.