Delta Plot Post Processing
Compare the difference between run and reference data.
View Delta Plot
Compare differences between input variable and output response run and reference data in a bar chart format from the Delta Plot post processing tab.
- From the Post Processing step, click the Delta Plot tab.
- Using the Channel selector, select the channels to display in the plot.
- Analyze the plot.
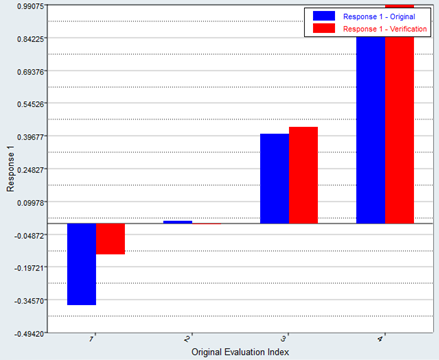
Figure 1.