Delta Scatter Post Processing
Visualize the difference between run and reference data.
View Delta Scatter
Visualize the differences between input variable and output response run and reference data in a scatter plot format from the Delta Scatter post processing tab.
This can be very useful to visualize the trade-off front after a multi-objective optimization.
- From the Post Processing step, click the Delta Scatter tab.
- Using the Channel selector, select the channels to display in the plot.
- Analyze the scatter plot.
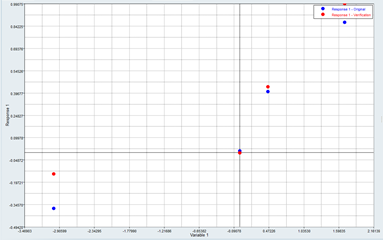
Figure 1.