Results Browser
The Results Browser resides on a tab in a tab area sidebar and allows you to view the HyperView model structure while providing find, display, and editing control of entities.
The Results Browser can be turned on or off using the Browsers > HyperView > Results option located within the View menu. A check mark indicates the Results Browser is activated for display in the tab area.
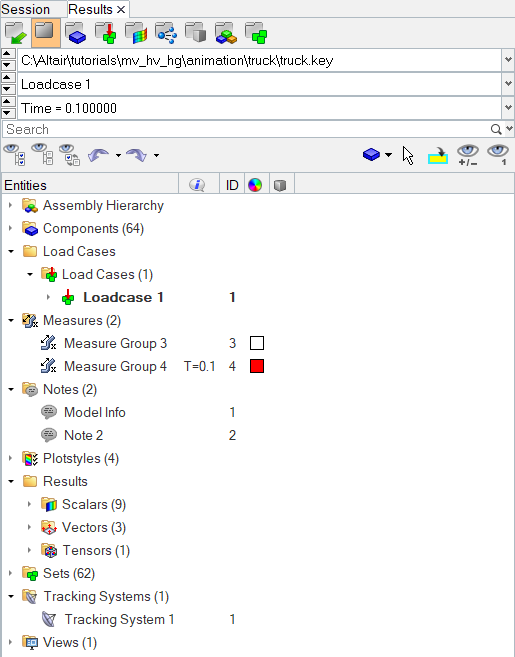
Figure 1. HyperView Results Browser
Click on the X to close the Results Browser.
Multiple entities of the same type are collected into folders in the tree structure. Each folder can be expanded or collapsed to display or hide its contents. Double clicking on a folder can open an entity specific view. Assemblies can also have sub-folders within the main Assembly folder, so that the items related to each assembly appear within that assembly’s folder in the Assembly Hierarchy.
Components and Systems may appear in multiple places in the tree; for example, a specific component might appear under Components and again as a sub-item of a specific Assembly or Entity Set. When appropriate, the color and display style of entities also display in the Results Browser.
- Toolbars provide the ability to change model views, show or hide entities within the model, and add entities to a HyperView panel collector. These abilities are collectively referred to as display controls and browser modes.
- The Context Sensitive Menu includes most of the same functions as the toolbars, as well as the ability to activate or deactivate search and sorting capability.
- You can find, sort, and filter entities in the Results Browser's tree list.
- The tree list within the browser is configurable, so that you can determine which columns and entity types that display in the tree.
Tool Button Groups
Many of the Results Browser functions are accessed via the View, Global Display, Quick Plot, and Action Modes groups of buttons. In the image below; the blue call-out is the View Tools, green is the Action Modes, purple is the Quick Plot, and red is the Global Display.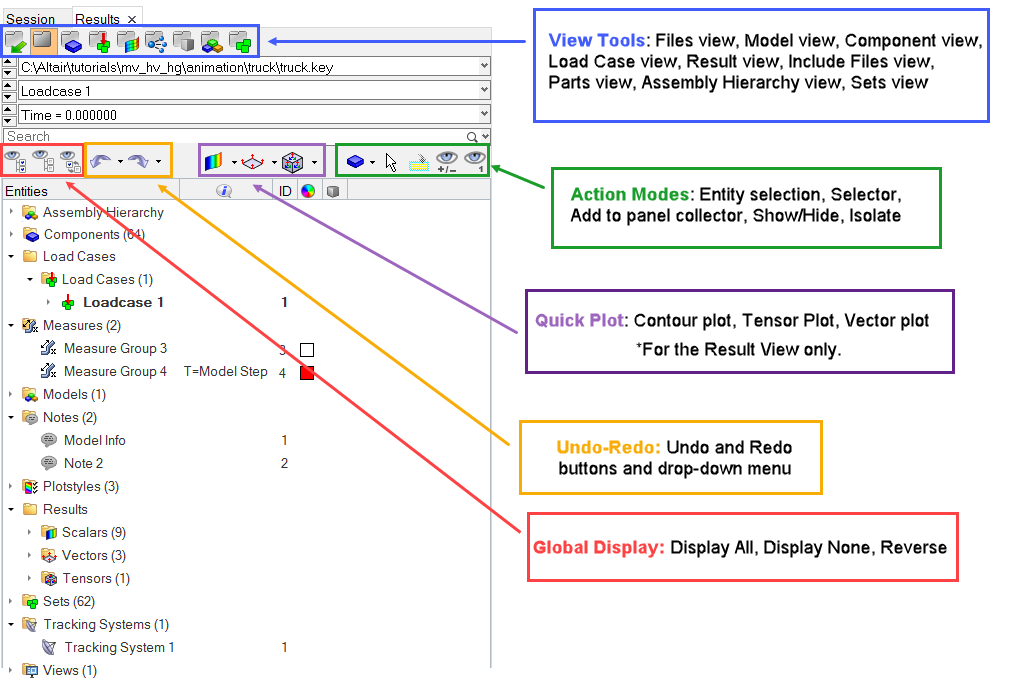
Figure 2.
Entity Editor
The Entity Editor section of the Results Browser allows you to view and edit various entity conditions/properties. Click on an entity or model file in the upper portion of the browser to automatically display the properties assigned to that entity in the Entity Editor (located in the lower half of the browser).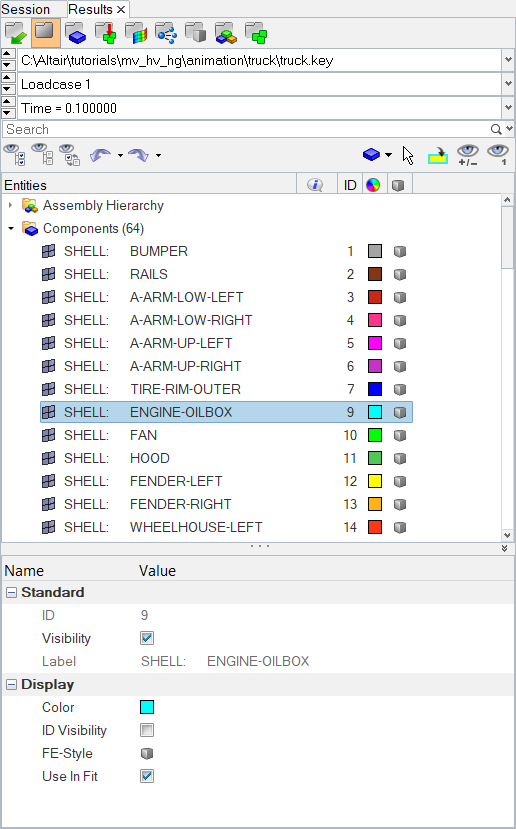
Figure 3.