Summary Table
Once an exploration is complete, review a summary of design variables and output response values in tabular format.
-
From the Design Explorer ribbon, select the Results
Explorer tool.

The Results Explorer browser opens. -
In the Results Explorer browser, select the Summary
Table
 tab.
The Summary Table shows a run-by-run summary of the exploration. The columns show the input design variable values for each run and the corresponding response values.
tab.
The Summary Table shows a run-by-run summary of the exploration. The columns show the input design variable values for each run and the corresponding response values.
Optimization Summary Table Data
The optimization summary table shows the design variable values along with the calculated objective and constraint values for each run.
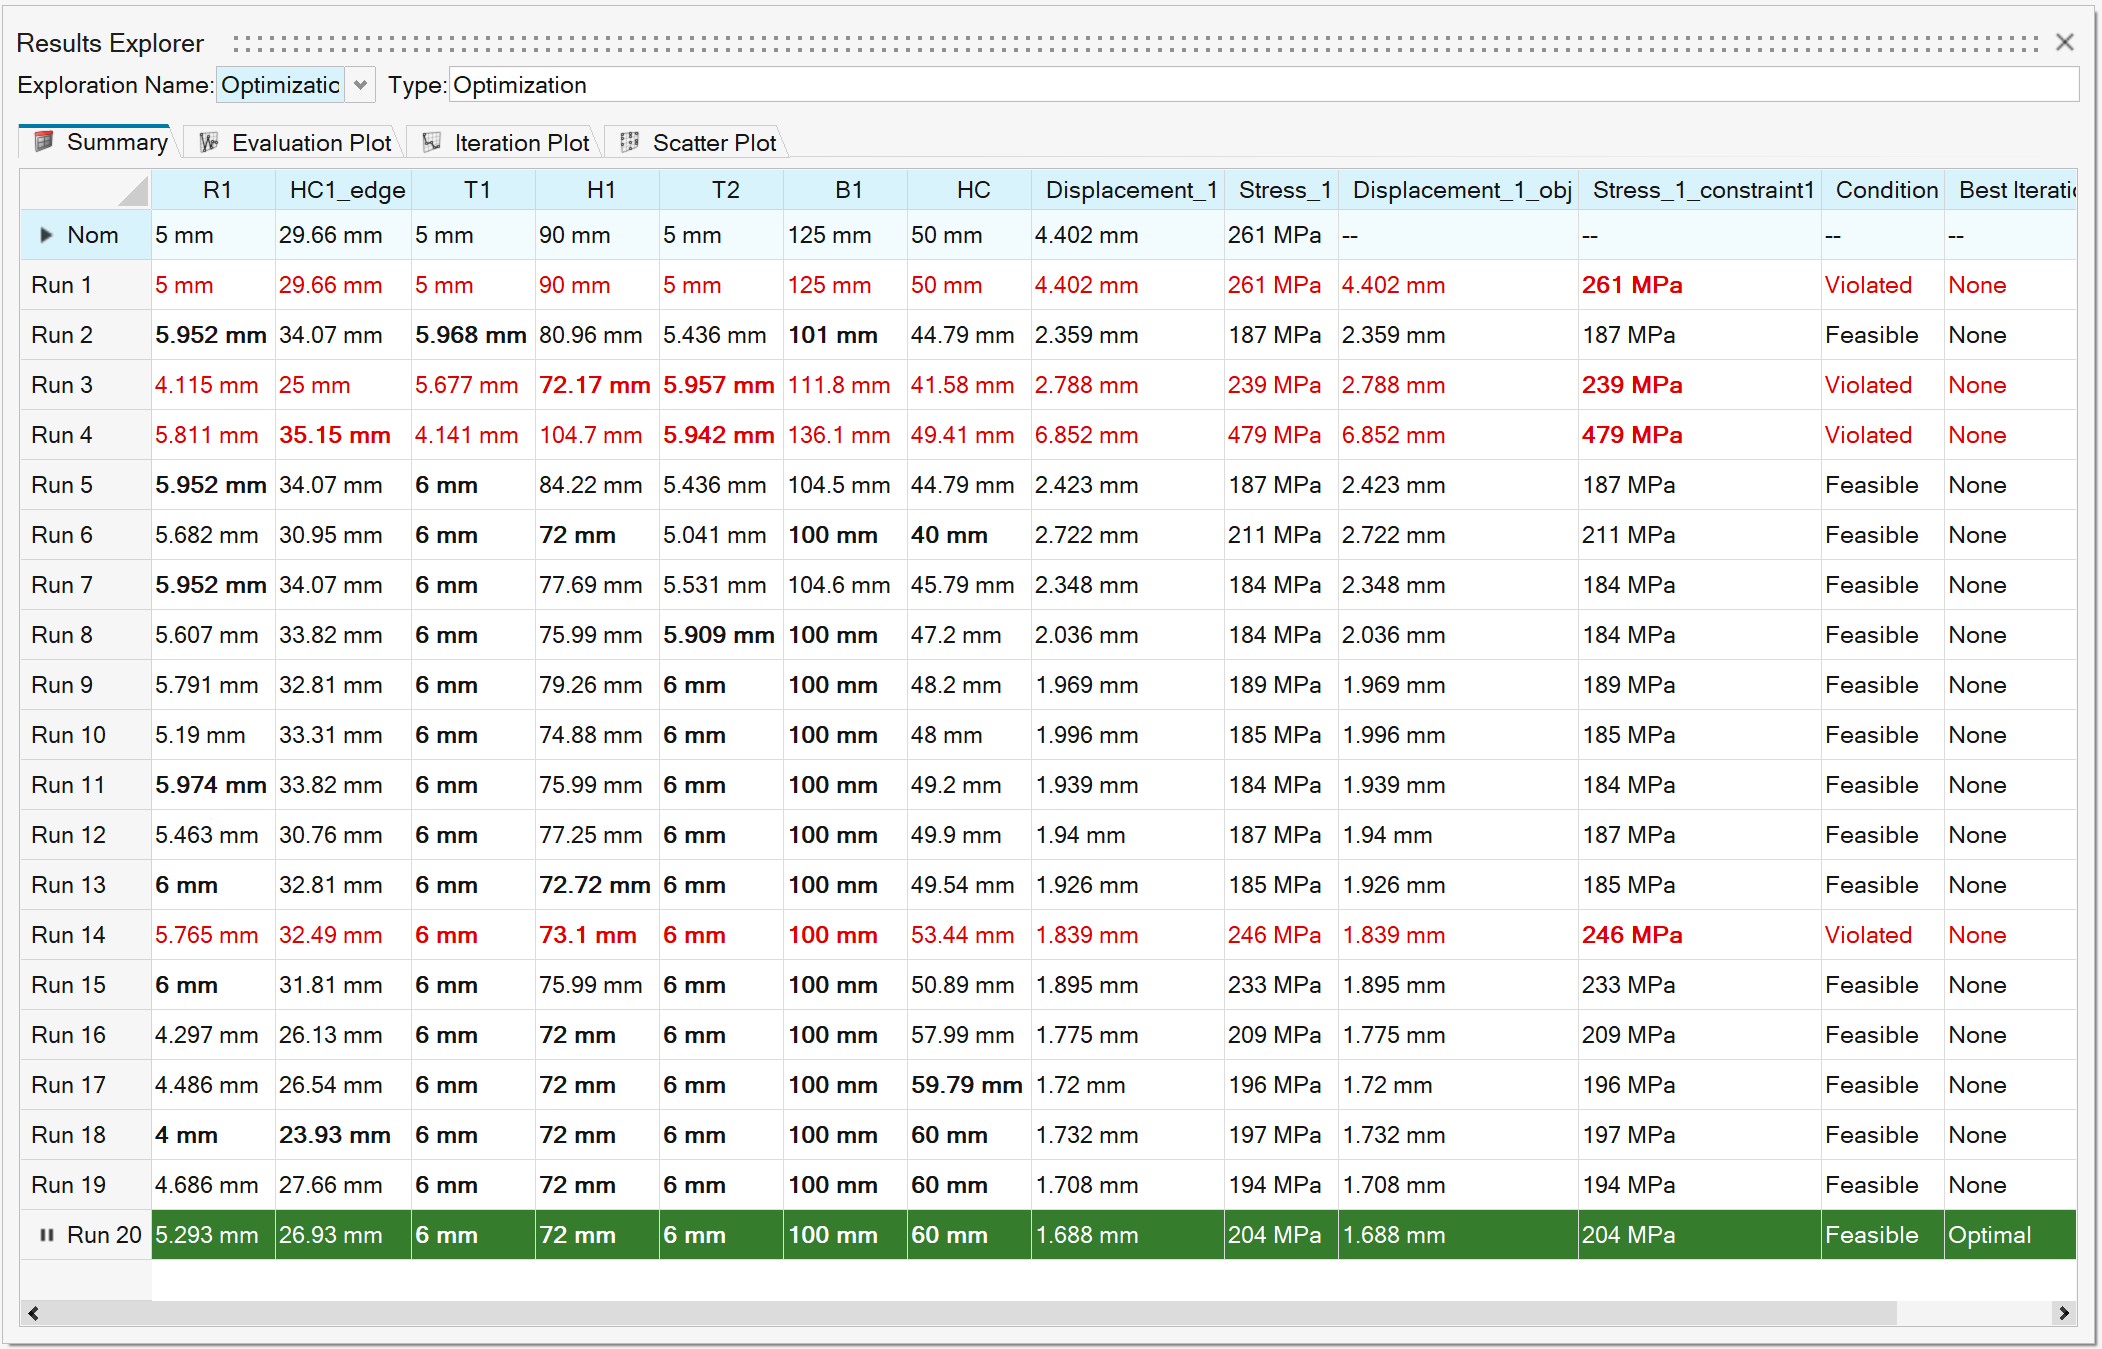
Color Coding
The Optimization Summary table uses color coding to help you determine which designs
are feasible, optimal, and violated. If an iteration contains a
violated constraint, the violated constraint is displayed in a bold font.
- White Background/Black Font
- Feasible design
- White Background/Red Font
- Violated design
- White Background/Orange Font
- Acceptable design, but at least one constraint is near violated
- Green Background/White Font
- Optimal design
- Green Background/Orange Font
- Optimal design, but at least one constraint is near violated
Load Results and Plots
Visualize contours, animations, and plots for each run in the modeling window.
-
Do one of the following:
- From the Design Explorer ribbon, Evaluate tool group, click the
Results Explorer tool.
- In the Results Explorer browser, click the Summary
Table icon .
- From the Design Explorer ribbon, Evaluate tool group, click the
Run Status satellite icon

- After submitting a simulation, this dialog will open automatically.Note: Using this dialog, individual runs can be contoured while the simulation is still in progress. Animations are not supported from the Evaluation Status dialog.
- From the Design Explorer ribbon, Evaluate tool group, click the
Results Explorer tool.