


|
Alpha Variable Configuration
The Alpha variable is available in the Dot Plot, Grouped Needle, Line Graph, Map Plot, Needle Graph, Numeric Line Graph, Numeric Needle Graph, Numeric Stacked Needle, Price Band Graph, Scatter Plot, Scatter Plot 3D, Spread Graph, Stacked Needle, Timeseries Scatter Plot, and Timeseries Scatter Plot in the Combination Graph visualizations.
Steps:
1. On the Visualization Settings pane, click the Alpha variable.
Initially, the variable has an Empty state.
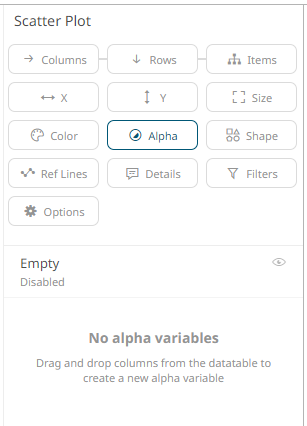
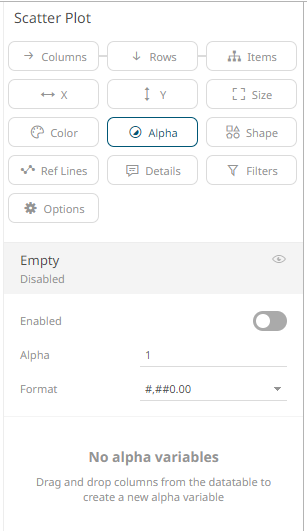
2. Click the Empty state value to expand its settings.
|
NOTE |
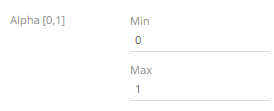
The Empty alpha variable has a minimum of 0 to maximum of 1 value, and a step of 0.01. The Up and Down buttons have been removed in previous changes to numeric input component, but the mouse wheel can still be used to scroll between values.
|
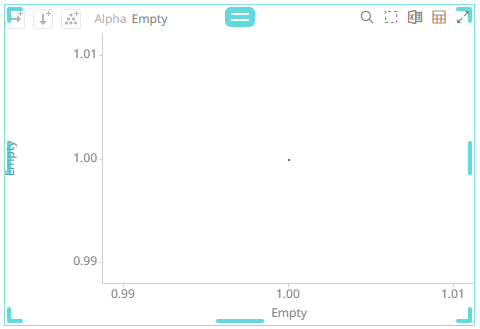
3. Tap the Enabled slider to turn it on. Empty currently displays as the associated value of the Alpha variable.
You can opt to modify the following properties:
|
Property |
Description |
|
Alpha Value |
Alpha value of the Alpha variable. The two nearest valid values are 0% and 100%. |
|
Format |
Format how numbers will be displayed. |
4. To associate other columns from the data table, drag and drop them to the Alpha variable drop area. Select one to display the corresponding configuration pane.
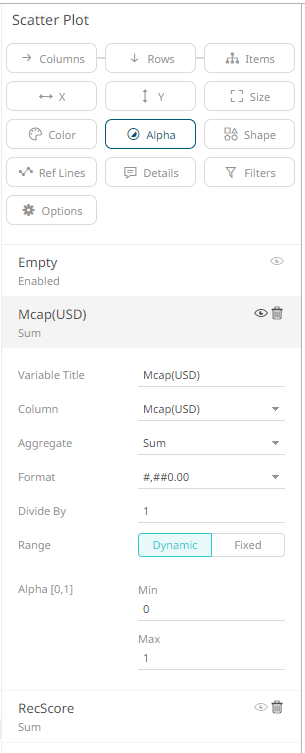
5. Enter the label of the Alpha variable in the Variable Title field.
You can parameterize the variable title to support dynamic schema in the dashboards.
6. You can also change the column to the be used as the Alpha variable from the Column drop-down list.
7. Specify the aggregation method in the Aggregate field.
The default is Sum.
The Alpha variable also supports a number of other aggregate types:
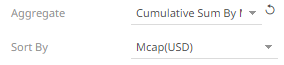
· If you set the aggregation method to Cumulative Sum or Cumulative Sum by Max, the Sort By drop-down list is enabled and displays a list of numeric data columns in the selected data table that can be used as the sorting column for the aggregate.
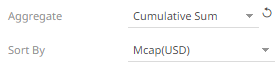
Cumulative Sum By Max is, in practice, Cumulative Sum with a setting to use Max as the sort by aggregation.
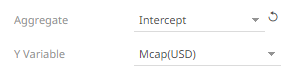
· If you set the aggregation method to Intercept or Slope, the Y Variable drop-down list is enabled and displays a list of numeric data columns in the selected data table that can be used as the Y-axis variable column for the aggregate.
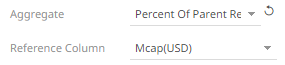
· If you set the aggregation method to Percent of Parent Reference, Percent of Total Reference, or Ratio of Sums, the Reference Column drop-down list is enabled and displays a list of numeric data columns in the selected data table that can be used as the reference column for the aggregate.
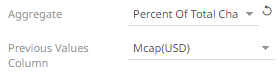
· If you set the aggregation method to Percent of Total Change, the Previous Values Column drop-down list is enabled and displays a list of numeric data columns in the selected data table that can be used as the previous column for the aggregate.
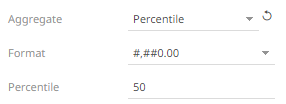
· If you set the aggregation method to Percentile, the Percentile field is displayed. Specify the value that can be used to calculate the value of the selected percentile.
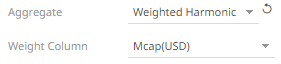
· If you set the aggregation method to Weighted Harmonic Mean, Weighted Mean, Weighted Population Variance, Weighted Stdev, Weighted Stdevp, Weighted Sum, or Weighted Variance, the Weight Column drop-down list is enabled and displays a list of numeric data columns in the selected data table that can be used as the weight column for the aggregate.
8. The Format field lets you specify the format that numbers will be displayed in. Panopticon uses the same formatting rules as Excel.
9. Select the Divide By value to divide a number:
· 1
· 1000 (by a thousand)
· 10000
· 1000000 (by a million)
· 1000000000 (by a billion)
10. The visible range for the Alpha variable can either be calculated dynamically (the default, enabled Dynamic).
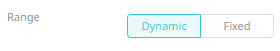
Or set between predefined limits by clicking Fixed. This reveals the Min and Max text boxes and populates them with default values taken from the data set.
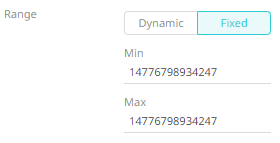
11. Enter the Min Alpha (default 0%) and Max Alpha (default 100%) values.
The Alpha variable takes any numeric column and maps the values to their corresponding Alpha values. Consequently, it calculates the values’ relative position in the domain of the column, and maps that to the same relative position for the domain of the Alpha values.
|
NOTE |
· This property is used as the alpha blending value between 0 (transparent) and 1 (opaque). · If an item has an undefined/null value, it will not be drawn. · The Min and Max alpha have a step of 0.01.
|
12. Click the Save  icon on the toolbar.
When
saved, the  notification
is displayed.
notification
is displayed.