


|
Managing Data Sources
A data table can consist of one or more data sources and can be connected to directly, with data retrieved on the fly as it is required.
Click on a data source on the Data Sources pane. The currently selected data source is highlighted (grey background) and the settings are displayed.
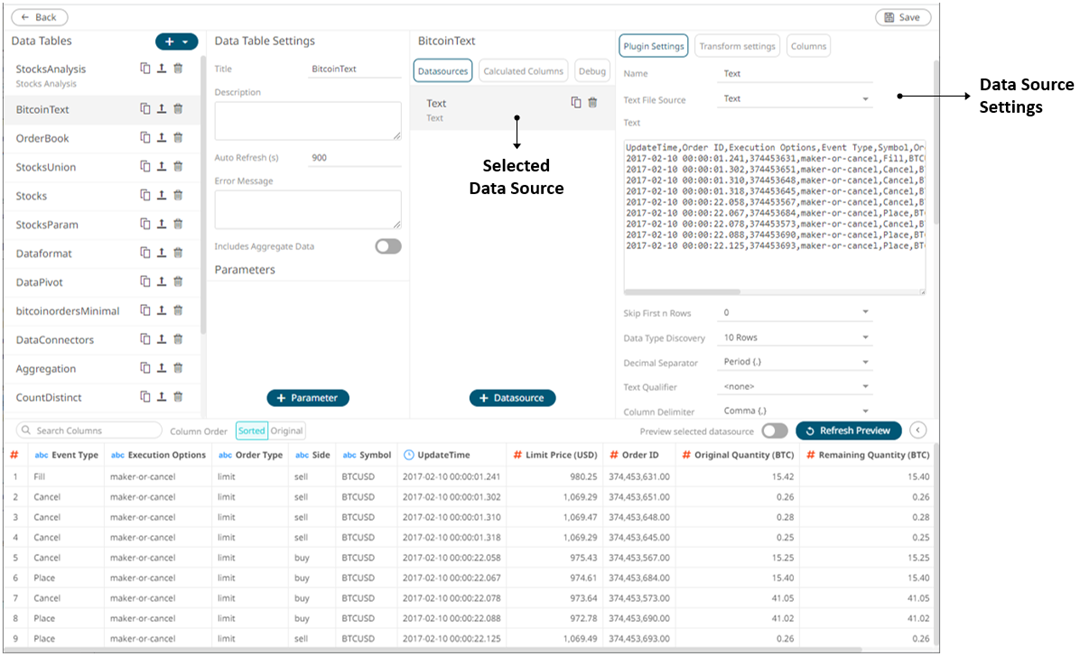
q Data Source or Plugin Settings
Sample 1
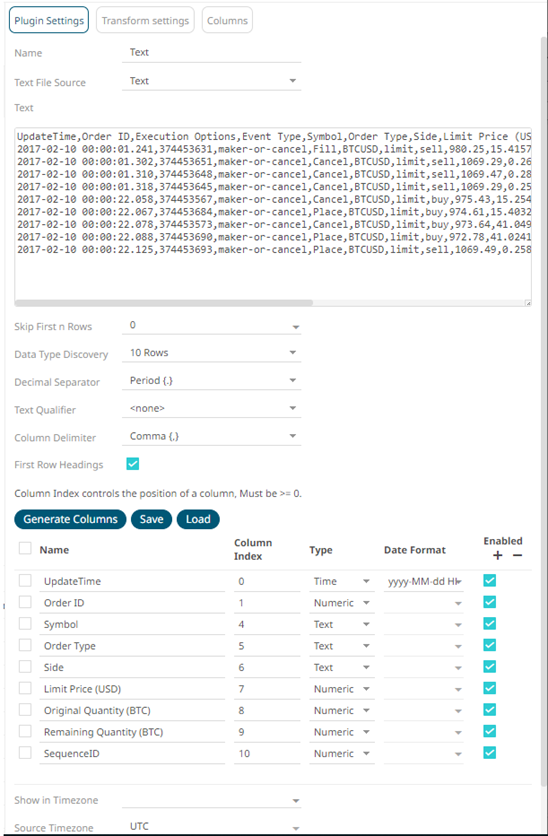
Sample 1 (Text Data – Manual Text) displays the text values and the properties of the generated columns based on the set properties (i.e., Skip First n Rows, Data Type Discovery, Text Qualifier, and Column Delimiter)
Sample 2
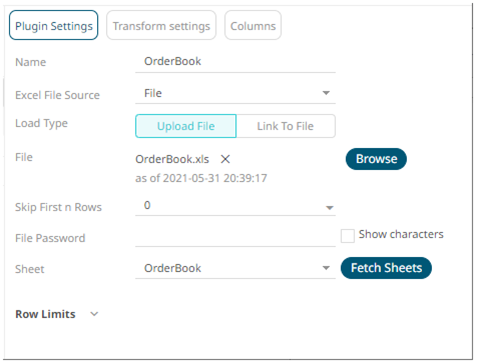
This lists options specific to the data source. In the case above for Sample 1 (MS Excel), it lists the file path to the Excel workbook, and the sheet to be used.
In the Data Sources Settings pane, the amount of data to be returned can also be specified.
For more information on the data source specific settings, refer to Data Connectors for more information.
q Transform Settings
Clicking the Transforms Settings button displays the transform settings of the currently selected data source.
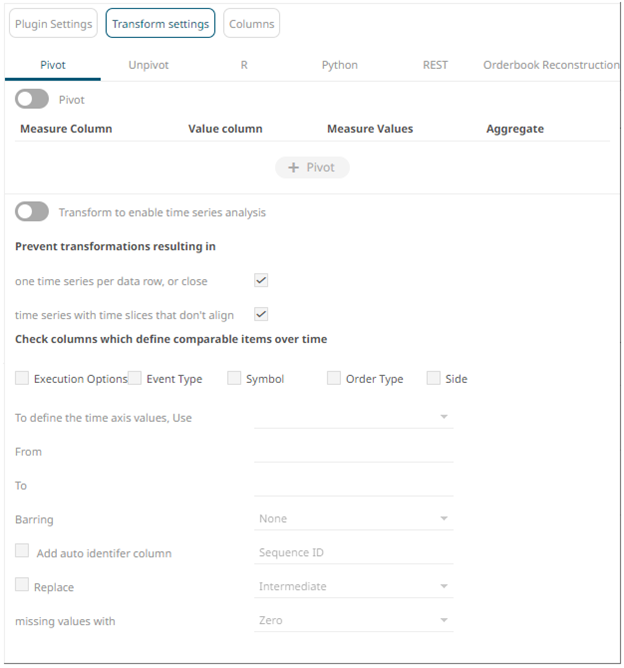
The Transform Settings allow for:
· Pivoting retrieved data
· Unpivoting retrieved data
· Transforming data to enable time series analysis including interpolation
· Running an R or Pythonscript for data transformation
· Running a REST Transform
· Lists of orders to be reconstructed into an Order book and conflated for output display
Clicking the Columns button displays the retrieved columns from the data source.
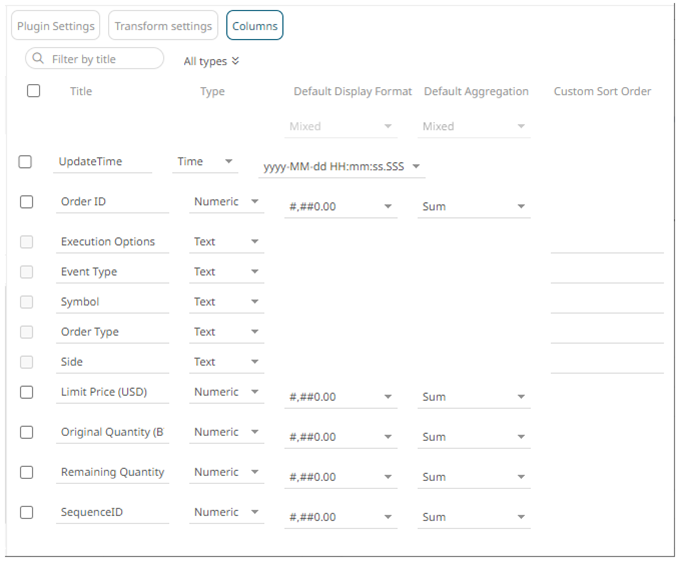
The Column Settings allows you to:
· modify the column data type
· rename column names
· select the numeric or Date/Time format
· select the numeric default aggregation