Curve Editor
Design and manage curves with the Curve Editor.
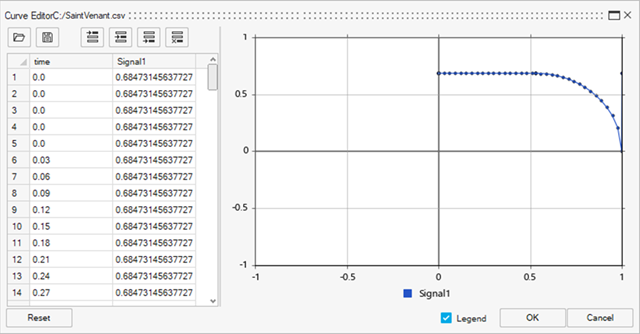
The Curve Editor lets you manually design a signal by moving the time signal curve on the grid or entering X and Y coordinate values.
Launch the Curve Editor
Launch the Curve Editor from the Tools menu or the SignalGenerator block.
-
From the Curve Editor dialog, select
 and navigate to the .csv file that contains your
curve data.
and navigate to the .csv file that contains your
curve data.
-
To launch the Curve Editor from a SignalGenerator block, double-click a
SignalGenerator block in your model, then select the
Curve Editor icon:
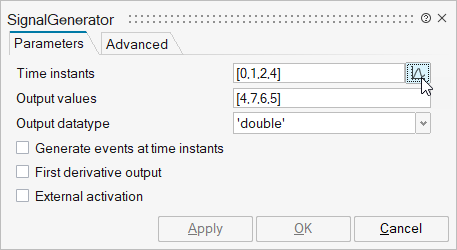 This option is useful for directly managing curves that serve as input into the SignalGenerator block.
 -
In the Curve Editor dialog, manipulate your curve as follows:
- Select and drag points to a desired location on the grid.
- Enter X and Y coordinate values.
-
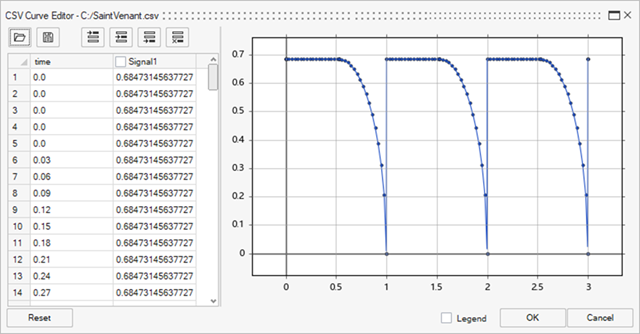
Use the Curve Editor options to further modify and manage your curve
data.
Option Description Load data from a .csv file. 
Save data to a .csv file. 
Insert a value before the first data point. 
Insert a value after the selected data point. 
Insert a value after the last data point. 
Delete the selected data points. Legend Select the check box to display the plot legend. Reset Select the Reset button to restore the default values for your curve.