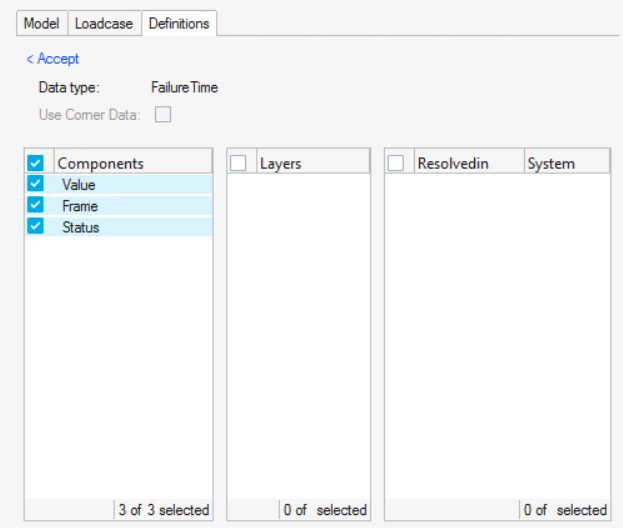
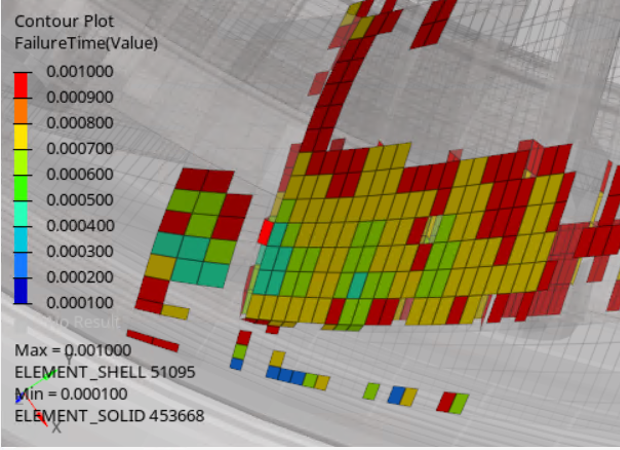
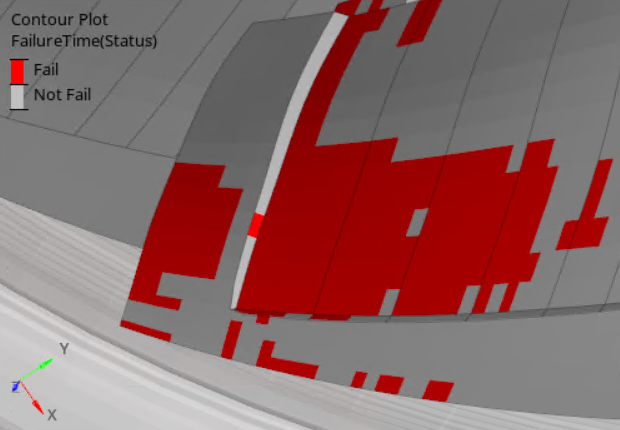
Contour time of failure or failure status of elements.
Failure Time is a special scalar result type that is created by
HyperView based on Erosion (failed elements) data available in the
result file. No extra step is required; if the results contains Erosion, then a data type
called FailureTime is automatically created.
Attention: This is available in the HyperWorks
HyperView – Upfront Loader profile only.
Note: The FailureTime contour plot is based on the steps that have
been loaded. For example, assume that a simulation has 50 steps, and no element fails in
the first 10 steps. If only the first 10 steps are loaded and FailureTime is contoured,
then the plot would show N/A. Therefore, it is recommended that all the steps of the
simulation be loaded before loading FailureTime in order to display precise failure
information on an element.
 Figure 1.
  Figure 2.
  Figure 3.