Generate Clusters
Using unsupervised machine learning, group exploration results according to user-specified criteria.
Restriction: Currently, clustering is only supported on Windows.
-
From the Design Explorer ribbon, Evaluate tool group, click the
Results Explorer tool.

Figure 1.The Results Explorer browser opens. -
In the Results Explorer browser, click the Clusters icon
 .
.
-
Click
 to create a new dataset.
The clustering report is generated. Depending on the size of the model and results, the report may take some time to generate.
Once generated, the Dataset dialog will close, and the newly created cluster information will appear.
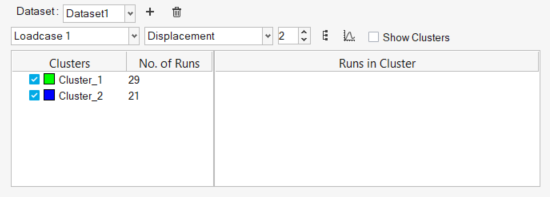
Figure 2.
Visualize Clusters
There are a number of tools and features to help with interrogation and visualization of cluster information.
-
Click Show Dendrogram
 to display the dendrogram for
a given clustering.
A dendrogram is a visual tool which shows the hierarchical relationship between clusters.
to display the dendrogram for
a given clustering.
A dendrogram is a visual tool which shows the hierarchical relationship between clusters. -
Click Show Cluster Score
 to display a silhouette plot
for a given clustering.
The silhouette plot provides an indication of the validity and consistency within the clustering and how well each run has been classified.
to display a silhouette plot
for a given clustering.
The silhouette plot provides an indication of the validity and consistency within the clustering and how well each run has been classified.