Define Curves
Edit existing curves or add new curves to the current plot.
The Define Curves panel also contains HyperGraph 3D's curve calculator.
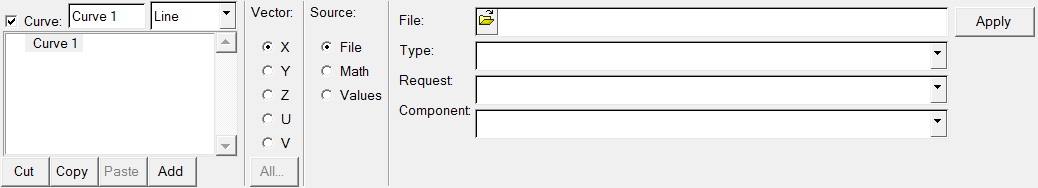
Figure 1.
Create and Define Curves
To edit a curve, select it from the Curve list or from the plot window.
If you select , the X, Y, Z, U, and V vectors are displayed in the Expression = field. Under Vector, select All or an individual vector to view and modify.
New data can be selected from a source file, mathematically defined using the program's curve calculator, or entered as values. The Define Curves panel options change depending on which source is selected.
Click Apply to define the curve(s).
Curve List
The curve list displays the names of all the curves in the active window.
Curves can be renamed, added, cut, copied, and pasted using the curve list controls.
If you select a curve from the list, its name is displayed in the text box above the list. Individual curves can be turned on or off.
The Cut, Copy, Paste, and Add buttons are used to maintain the curve list for the active window. Curves can be copied and pasted into other windows. Curves can also be added and deleted from the list.
If you select Waterfall from the curve type menu, an additional Add Slice button is displayed. When the curve type is set to Waterfall, Add adds a new waterfall plot and Add Slice adds a new slice.
- Line
- Display, add or edit 3D line curves.
- Surface
- Display, add, or edit surface curves.
- Waterfall
- Display, add, or edit waterfall curves.
Vector
Select the X, Y, Z, U, or V curve vector from the list.
Click All to display the All dialog and edit each curve vector.
Source
- File
- When selected, the file options are displayed, allowing you to select data files for the X, Y, Z, U, and V vectors.
- Math
- When selected, the curve calculator is displayed, allowing you to define the vector mathematically.
- Values
- When selected, the Values table is displayed, allowing you to directly enter data point values.
You can cut, copy, paste, and insert data point values to the table. Click the
expansion button,  , to view a larger dialog containing all data
points.
, to view a larger dialog containing all data
points.
Referencing Curves
Expressions can reference any curve or vector in the current session. Curve vector references can be defined by picking the curve with the mouse or by using the following syntax:
pmwnco.vector
where:
m is the number of the page on which the curve resides
n is the number of the window which contains the curve
o is the number of the curve in the window
vector indicates the X, Y, or time vector of the referenced curve
For example, p2w1c3.y references the Y vector (.y) of the third curve (c3), in first window (w1), on the second page (p2).
When a referenced curve is edited or updated, the curves that reference that curve are updated as well.
The Curves dialog allows you to view the curves on a particular page within a session.