Waterfall
Create waterfall plots from XY force response data and input pulses.
If a waterfall plot exists in the current window, HyperGraph 3D automatically populates the default values. Otherwise, you can enter information into the panel's fields.
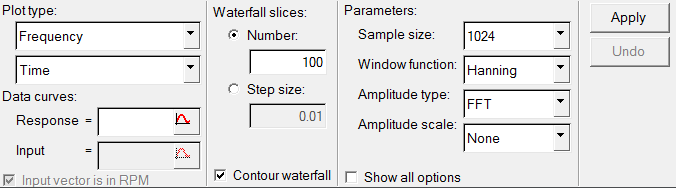
Figure 1.
Plot Type
Select a waterfall plot type from the first drop-down menu. Options include:
- Frequency
- Default.
- Order (scaled)
- Calculates orders by scaling the frequency values by the input magnitude values.
- Order (resampled response)
- Modifies the time values of the response curve so the FFT returns order instead of frequency.
- Order (variable DFT)
- Calculates orders by scaling the frequency values by the input magnitude values. Uses a DFT with a varying sample size to ensure a consistent density of points along each waterfall slice.
From the second drop-down menu, select:
- Time
- Default.
- Input magnitude
- Instead of plotting against time, plot against the units of the input curve's magnitude (RPM, RPS, driving frequency, and so on.)
Note: If you change the Plot type settings, HyperGraph 3D updates the From and To labels on the far
right side of the panel to match your selections. These fields are displayed
when you select Show advanced parameters.
Data Curves
The Response curve can be defined by following these steps:
- Click the curve selection button,
 ,
in the Response text box to display the Response dialog.
,
in the Response text box to display the Response dialog. - Choose a curve from the Curve tree and click Select.
- You can also click Preview to view the curve in the Preview dialog before selecting it.
- Click Close to close the Curve dialog.
OR, select one of the following methods:
- Select the curve from an XY plot window.
- Enter the PWC math reference and press Enter.
- Press and hold Shift and left-click on the curve.
Input
Select the input vector used to generate the response vector and press Enter. Input curves can be selected in the same way as Response curves (see above).
- Input vector is in RPM
- Select this option to scale the response curve by 60 to use RPS.
Waterfall Slices
- Number
- Enter the number of samples.
- Step size
- Enter the step size. A sample will be taken at each step increment.
- Contour waterfall
- Display a contour on the waterfall plot based on "Z".
Parameters
For each of the following parameter fields, select an item from the drop-down menu. Click Apply to apply the parameters.
- Sample size
- Number of data points to use in each FFT.
- Window function
- The windowing function for FFT.
- Amplitude type
- Peak, PSD_RMS, or Auto spectrum.
- Amplitude scale
- None, DBA, DBC, DB4, or DB.
- Show all options
- Select this option to display additional parameters.
Summary and Frequency
The following parameters are displayed if you select Show all options.
- Summary
- Freq resolution
- Twice the delta frequency returned from "freq(response_curve.x)". Or, the third point minus the first point returned from the frequency calculations.
- Nyquist freq
- Half the maximum value returned from "freq(response_curve.x)".
- Max order
- The Nyquist frequency divided by the maximum value in the input curve’s magnitude.
- Number of points
- The number of points in the Response curve.
- Time increment
- The delta time in the Response curve or the difference between the first two points of the X axis in the Response curve.
- Frequency
- From/To
- Two sets of From/To fields are displayed at the far right of the panel. The headings above From/To change depending on the Plot type options selected. For example, if you select Frequency and Time, those headings are displayed above the From/To fields. If you select Order (scaled) and Input magnitude, those headings are displayed. For any option you select under Plot type, enter the desired range in the From/To fields.
- Apply
- HyperGraph 3D creates or modifies the waterfall plot based on your selections.
- Undo
- Restores the waterfall plot to its previous state.