Sheer Moment Plot
Automatically generates Shear-Moment-Torque (VMT) plots.
It requires an *.fbd file from the Resultant Force and Moment (RF&M) utility as its input file. You can select the sections and loadsteps from the *.fbd file to include in the plot, as well as several other plot options described below.
Load File
Click the file browser icon, ![]() ,
to select the path and name of the RF&M utility's FBD file that contains the
data to generate the plot.
,
to select the path and name of the RF&M utility's FBD file that contains the
data to generate the plot.
Sections
The Sections selector displays all cross-sections available in the selected FBD file. The Sections selector allows you to specify which cross-sections in the selected FBD file to include in the plot. Multiple cross-sections can be selected using the standard Ctrl/Shift functionality.
-

- Search for a particular filename.
-

- Select all sections or subcases listed.
-

- Exchanges the currently selected items for the unselected items in the list.
-

- Deselects all selected items.
Loadsteps
The Loadsteps selector lists all subcases available in the selected FBD file. The Loadsteps selector allows you to specify which loadsteps in the selected FBD file to include in the plot. Multiple cross-sections can be selected using the standard Ctrl/Shift functionality.
The Loadsteps filter buttons allow for additional selection control (see above).
VMT Plots
- X component
- From this menu, select the X, Y, Z, or Mag coordinate values of the summation node for each cross-section. Only one X component may be selected.
- Y component
- From this menu, select the Fx, Fy, Fz, Mx, My, or Mz coordinate values. These values are defined in the results coordinate system for each cross-section. Multiple Y components can be selected using the standard Ctrl/Shift functionality.
Plot Titles
From this tab, you can define a title and subtitle for all generated plots.
Plot Options
From this tab, you can define several options for generating plots. They include:
- Reverse sign
- Allows you to reverse the sign (+/-) of the output at one or more cross-sections. The top drop-down menu is populated with the list of selected cross-sections.
- Reverse Types
- The bottom drop-down menu lists the type of reverse to be performed.
Options include:
- Reverse selected section
- Reverses the sign of the output at only the selected section.
- Reverse all but selected section
- Reverses the sign of the output at all sections but the selected one.
- Reverse all
- Reverses the output at all sections.
- Reverse none
- Does not reverse any data.
- Envelop
- Generates an envelope curve for each selected Y component that contains either the maximum value across all selected loadcases or the minimum value across all selected loadcases at each cross section.
- Layout
- Allows you to choose the plot layout. Options include:
- One plot per subcase
- One plot is generated for each selected subcase. All selected Y components are plotted for each subcase on each corresponding plot.
- One plot per Y component
- One plot is generated for each selected Y component. All subcases are plotted for each Y component on the corresponding plot.
- One curve per plot
- One curve is placed on each plot. The number of plots is equal to the number of Y components multiplied by the number of selected subcases.
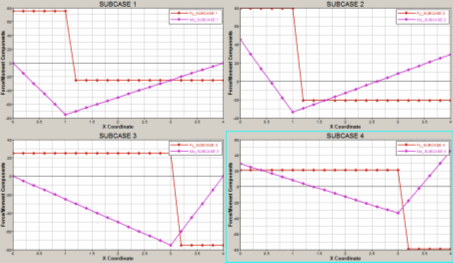
Figure 1. Sample output for X vs Fy and Mx for four subcases. The Envelop results option is unchecked. The Layout option is set to One plot per subcase.
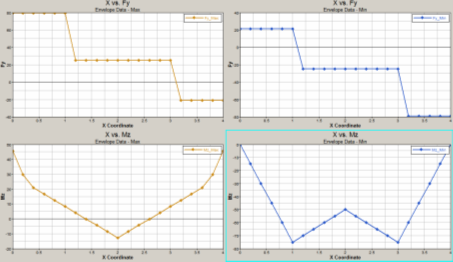
Figure 2. Sample output for X vs Fy and Mz for four subcases. The Envelop results option is enabled for both Maximum and Minimum. The Layout option is set to One curve per plot.