Order Analysis - Load
Perform file and result selection.
From the , select an OptiStruct or Nastran result file to load. Once the file is read, subcases from the result file are matched to RPMs, or orders. The NVH utility attempts to automatically match the subcases and orders by using text information in the subcase label. If this fails, you must complete the Subcase identification section, located on the Subcase tab. Once the match is complete, click the Apply button to populate the Result selection fields, located on the Order Response tab.
- File selection
- From the field, select a frequency response file containing RPM-based loading subcases or order-based loading subcases and click Load. Once the file is read, subcases from the result file are matched to RPMs, or orders, and can be reviewed in the Subcase identification section, located on the Subcase tab. The NVH-Utility attempts to automatically match the subcases and orders by using text information in the subcase label. If this fails, you must complete the Subcase identification section and click Apply. Once the match is complete, the Order Response tab is displayed and the Result selection fields are populated.
- Result selection
- The following fields are available on the Order Response tab, under
Result selection.
- Result type
- This field is populated based on available result types from the file loaded. Select a result type for order analysis.
- Response ID
- Grid ID of the response for which order analysis results are available. Select one from the list.
- Response label (optional)
- Enter a label that describes the response, for example, "Left Engine Mount".
- Direction component (optional)
- X, Y, Z, RX, RY, RZ, or XYZ Vector Sum.
- Complex component
- Magnitude or phase.
- Range selection
- Customize the RPM range and Frequency range fields as necessary.
- Order Cuts
- After viewing the surface plot, use the Start, End, and Step fields to specify the orders you want to see by cutting the surface plot.
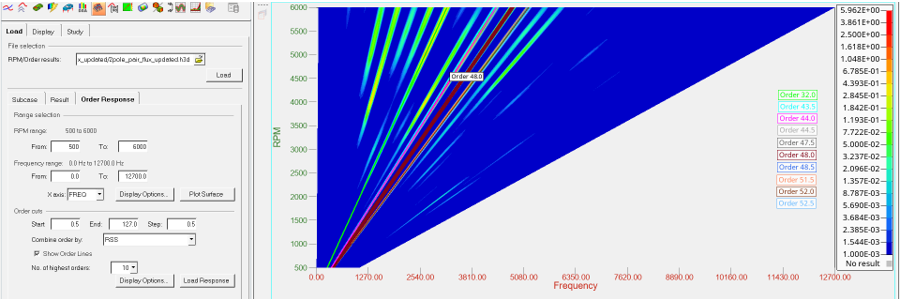
Figure 1. 3D Surface Plot (Waterfall Diagram)
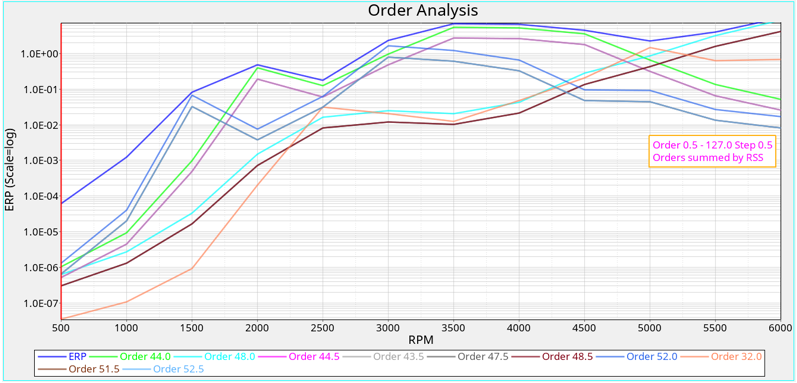
Figure 2. 2D Line (Order Contribution Analysis)