Order Analysis - Study
After plotting the order analysis curves, perform a Partial sum or Order overlay response study.
- Study/Curves over
- Select the type of study to display. Choose between RPM or Frequency.
- RPM Range
- Indicates the available range, based on your results file.
- Type
- The type of response study.
- % to exclude
- Optional field that allows you to exclude a percentage of the orders from the order sum response.
- Select order to
- Select the orders that you want to exclude or include in the response
study.
- Click
 to select the entire list of
orders.
to select the entire list of
orders. - Click
 to deselect your current
selections.
to deselect your current
selections. - Click
 to exchange the currently selected
orders for the unselected orders in the in the list.
to exchange the currently selected
orders for the unselected orders in the in the list. - Click
 to select the design variables of
the highest sensitivity from the last Bar plot.
to select the design variables of
the highest sensitivity from the last Bar plot.
- Click
- Show difference curve as
- Shows the difference between the original curve and the partial sum curves.
- Display Options
- Launches the Display Options dialog, which allows you to further customize the plot.
- Display
- Click Display to display the response study plot once your selections are complete.
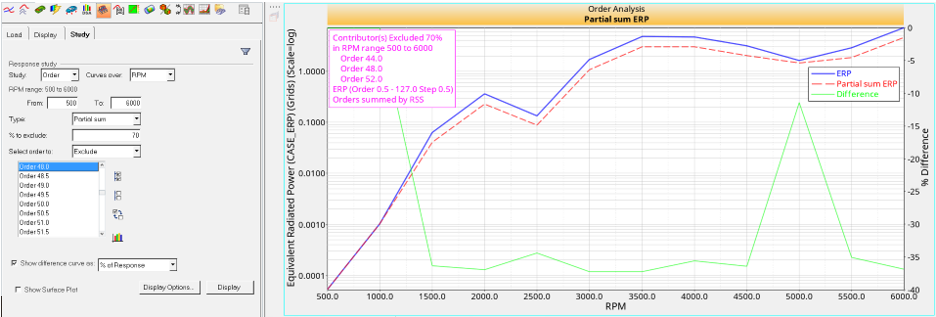
Figure 1. Response study plot