HG-1020: Modify Plots
In this tutorial, you will learn how to modify plots.
- Work with the Axes panel
- Use the Coordinate Info panel and TextView
- Modify curves
- Create secondary axis and assign curves to them
- Click the Axes icon,

- From the menu bar, select
This panel allows you to add multiple axes to plots. Also, axis attributes such as labels, color, and scaling can be modified.
To access Convert Units tool, right-click on the plot axis and select Convert Units.
The Convert Units tool allows you to convert the current unit of measure of a horizontal or vertical axis to another unit of measure. All curves associated with the axis are scaled accordingly and the axis label is updated to reflect the new unit of measure.
 Figure 1.
 - Click the Coordinate Info icon,

- From the menu bar select
This panel allows you to retrieve individual point data on any curve in the active window. When a point is selected, its data is displayed in the panel.
To access TextView, use the Select Application menu and
click TextView, ![]() .
.
The text editor window allows you to view, edit, and save text files, conduct text searches, change text attributes, and evaluate Templex. With Templex, you can obtain curve data from the plot window and display the results in text format in the text window.
- Click the Modify Curves icon,

- From the menu bar, select
The Modify Curves panel enables you to modify curve data pertaining to a plot. Curves can be deleted, trimmed, bridged, or hidden within a specified range and orientation.
- Click the Scales Offset and Axis Assignments icon,

- From the menu bar, select .
Curve scaling, offsets, and axis assignments can be applied to multiple curves using this panel
Open Session File demo_3.mvw
- From the File menu click .
- From the plotting folder, select the demo_3.mvw file and click Open.
Using the Convert Axis Units Tool to Scale the Y Axis
Change the Y Axis Label for Window 1 to Force (kiloNewtons)
-
Click the Axes panel icon,
 .
The Primary axis is highlighted or active in the Axes list.
.
The Primary axis is highlighted or active in the Axes list.
Create a Datum Line
- Activate window 2 on page 2.
-
Click the Datum Lines panel icon,
 .
.
- Click Add.
- Verify that the choice under the selection for Datum is Horizontal.
- Select the Position tab.
- Verify that Axis is set to Primary.
- For Position, enter the expression sin(90) +100-cos(0) and press Enter.
- Click the Line Attributes tab and select a different color for the line.
Trim the Curves
-
Click the Modify Curves icon,
 .
.
-
To the right of the Curves field, press the curves icon,
 .
The Select Curves dialog is displayed.
.
The Select Curves dialog is displayed. -
Under Action, click Trim to remove the data outside of
the specified range for the selected curves.
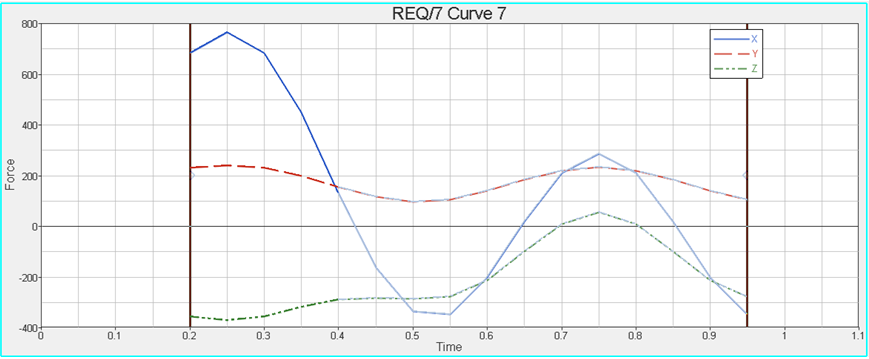 Figure 2.
Create a Secondary Y Axis in a Plot Window
-
Click the Add Page icon,
 .
.
-
Go to the Build Plots panel,
 .
.
-
Go to the Axes panel,
 .
.
-
Go to the Scales, Offsets, and Axis Assignments panel,
 .
.
-
Click Fit,
 , to fit the curve to the plot window.
Use Templex to Obtain Information for Existing xy Curves
-
Click the Page Layout icon,
 , and select a two-window layout
  .
.
-
From the Select Application menu, select TextView
 .
.
 Figure 3.
 -
From the toolbar, click the Edit Text button,
 .
The Templex statements are evaluated and displayed.
.
The Templex statements are evaluated and displayed.The text editor window is now in non-edit mode.
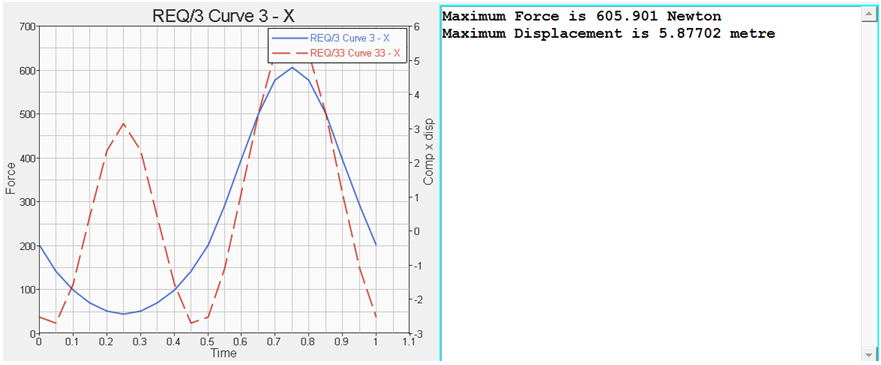 Figure 4.