HG-1040: AVD Diagram Using Unit Scaling and Plot Browser
In this tutorial, you will learn how to create and acceleration velocity plot using scaling and the plot browser.
- Create an Acceleration Velocity Displacement plot in one window
- Use the unit scaling feature for a plot.
- Use the Plot Browser to change the appearance of a plot, such as modifying the axes names, unit type and curve line color.
- Click the Build Plots icon,

- From the menu bar select
This panel allows you to construct multiple curves and plots from a single data file. Curves can be overlaid in a single window or each curve can be assigned to a new window.
The Plot Browser resides on a tab in the Tab Area sidebar and allows you to view the HyperGraph 2D plot structure. The Plot Browser tools allow you to search, display and edit entities and their properties within the current session. The plot structure is viewed as a flat, listed tree structure within the browser. However, if the plot has a hierarchy, then the Plot Browser accommodates this hierarchical structure.
From the Plot Browser, you can select entities one at a time or several simultaneously using common selection techniques. You can also use the browser's context-sensitive menus to select entities. Using the Plot Browser, you can perform many of the operations available in the HyperGraph 2D panels, thus allowing you to modify your plot and curve properties in one location.
Clear any Units Association and Enable Unit Scaling
-
From the Tools menu, select Reset Units
Association.
The Reset Units Association dialog is displayed.
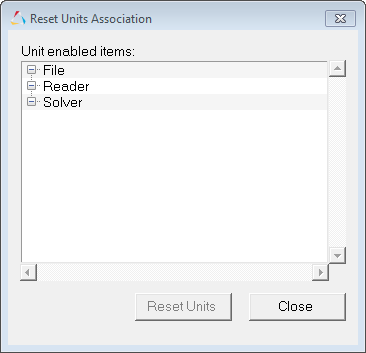 Figure 1.
 -
From the toolbar, click the Options icon,
 .
.
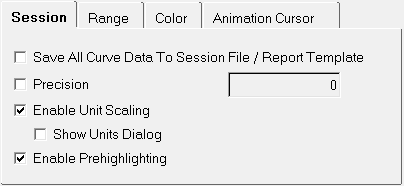 Figure 2. The Options panel is displayed.
Open the nodout File
- From File menu, select to clear all contents in the HyperGraph session.
-
Verify XY Plot is selected from the plot type menu,
 .
.
-
Click the Build Plots icon,
 .
.
-
Click the Open File icon,
 , and select the nodout file,
located in the plotting folder.
, and select the nodout file,
located in the plotting folder.
Plot the Curves and Set the Curve Units
-
Return to the Build Plots panel, .
-
From the Units Profile dialog, select the
C radio button and click
OK.
This sets the Length, Time and Mass units for the file to millimeter, milliseconds, and kilograms, respectively.
 Figure 3.
 -
Click Apply.
The displacement, velocity and acceleration are plotted.Note: Two additional axes have been added to the right of the window to accommodate the velocity and acceleration data (use your plot with your default setting).
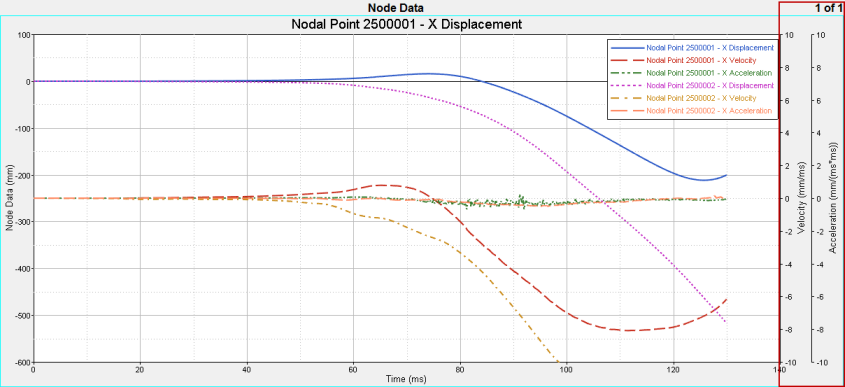 Figure 4.
Modify the Plot's Appearance and Rename an Axis
In this step, you will use the Plot Browser to change the appearance of the plot.
-
From the Plot Browser, click the Axes icon,
 .
.
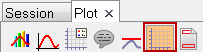 Figure 5.
 -
From the Properties Table, located in the bottom portion of the Plot Browser, click the color palette next to Color and select
black.
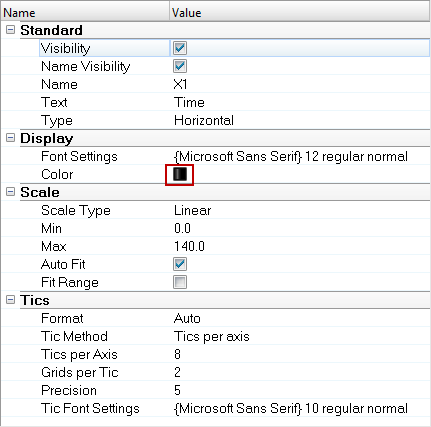 Figure 6.
Next, you will rename the axes using the Plot Browser.
-
Repeat steps 9 and 10 for the Y1, Y2, and Y3 axes. Rename them Node
Data, Velocity and
Acceleration, respectively.
The new vertical axes names for X1, Y1, Y2 and Y3 are shown below:
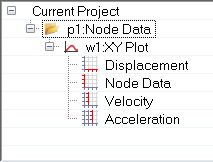 Figure 7.
Modify the Curve Line Color
-
From the Plot Browser, click the Curve filter icon, .
-
From the same expanded w1:XY Plot folder, select the X
Velocity curves.
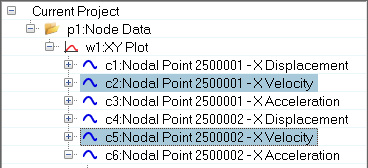 Figure 8.
 -
From the Plot window, right-click on the horizontal axis to display the
following context menu:
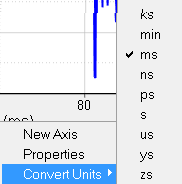 Figure 9.
 -
You can also change the unit type for a curve by right-clicking on the curve
and selecting Enable/Change Curve Unit.
The Enable/Change Curve Unit dialog is displayed.
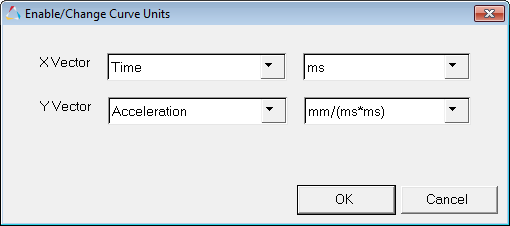 Figure 10.
 -
Click OK.
The final plot window is shown below:
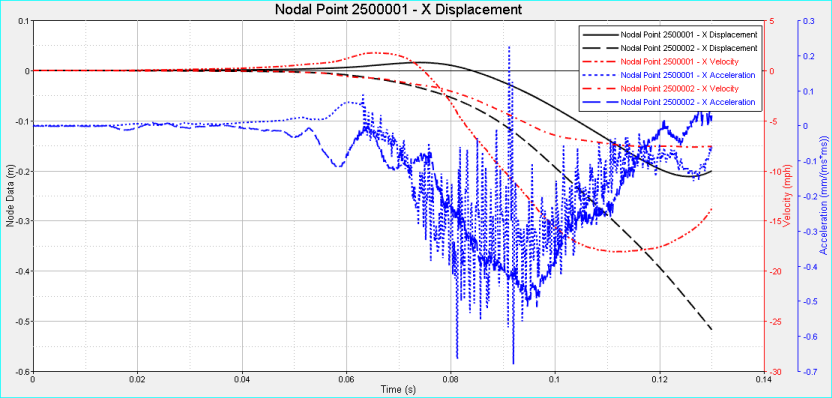 Figure 11.