HG-1021: Modify Plots with the Plot Browser
In this tutorial, you will learn how to modify plots with the Plot Browser.
You can use the Plot Browser tools to search, display and edit entities and their properties within the current session.
- Modify the following plot attributes
- Header font size
- Legend position and font size
- Axis fonts
- Modify the following curve attributes
- Curve name and prefix
- Line style
- Color
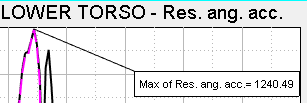
- Add notes attached to curves
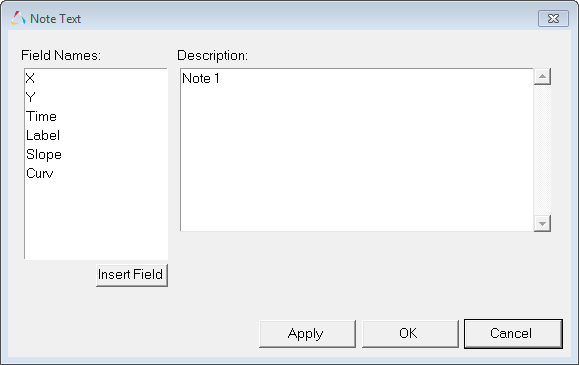
- Modify notes in the Notes panel
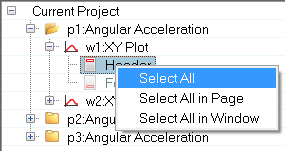
- Apply these changes to all notes using the Plot Browser
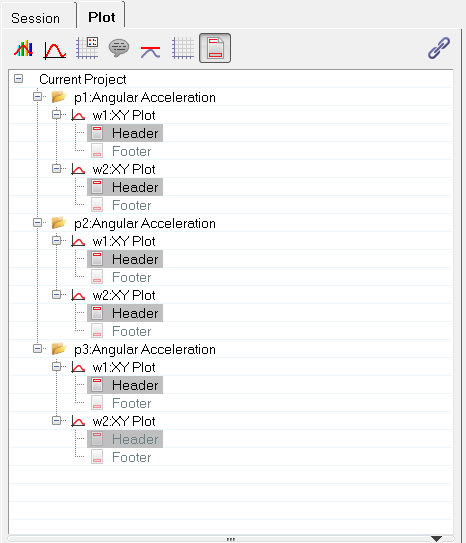
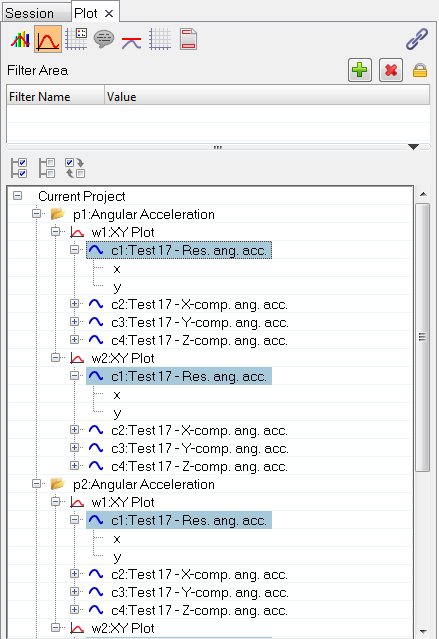
The HyperGraph 2D Plot Browser resides on a tab in the Tab Area sidebar and allows you to view the HyperGraph 2D plot structure.
The Plot Browser can be turned on or off using the menu options. A check mark indicates that the HyperGraph 2D Plot Browser is activated for display in the Tab Area.
You can use the Plot Browser tools to search, display and edit entities and their properties within the current session.
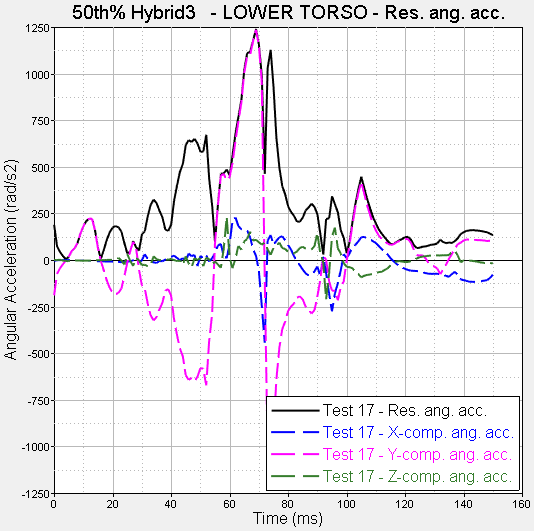
Open Session File demo_browser.mvw
- From the File menu click .
- From the plotting folder, select the demo_browser.mvw file and click Open.
Modify the Header Font Size
Modify the Legend Font Size and Change the Legend Position
Modify the Axis Font Size
Modify the Curve Name
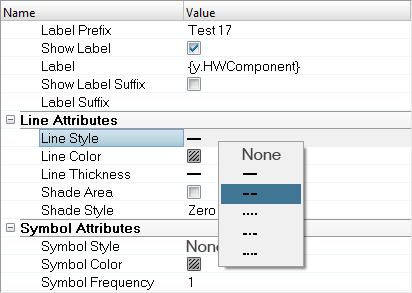
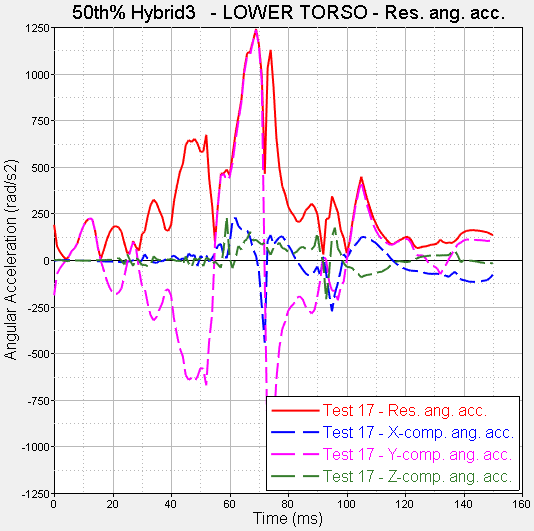
Modify the Curve Line Style and Color
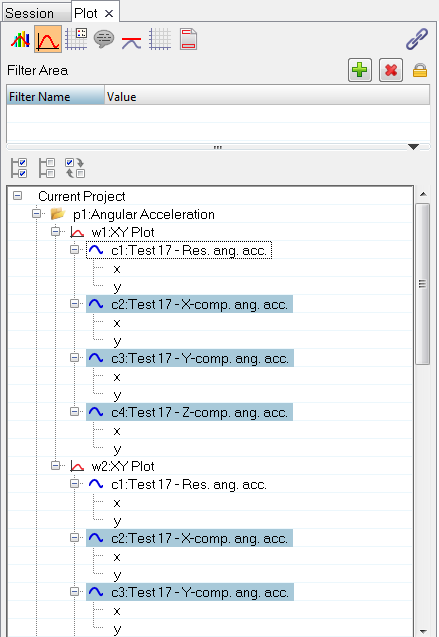
In this step, you will change the curve line style for all curves that contain the components XYZ.
Add and Modify Notes
Next, you will use the Notes panel to modify the note.
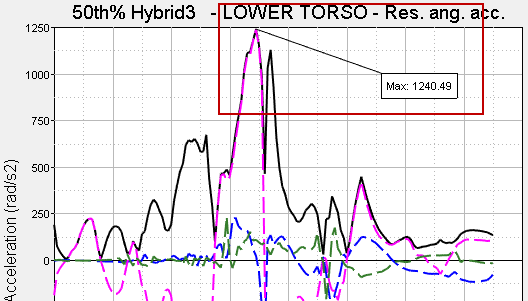
Next, you will apply the note text to all the curves in the session using the Plot Browser.
 , from the top of the browser.
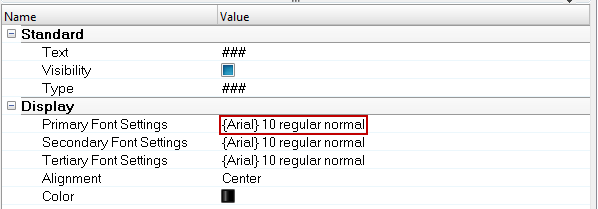
 , from the top of the browser.
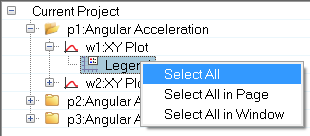
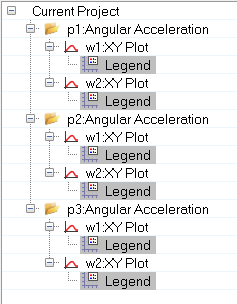
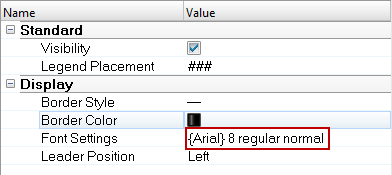
 , from the top of the
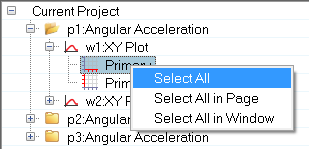
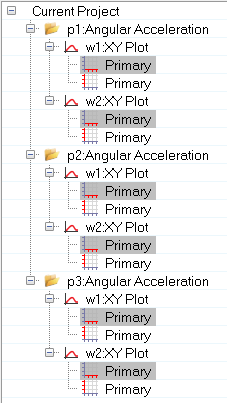
 .
.


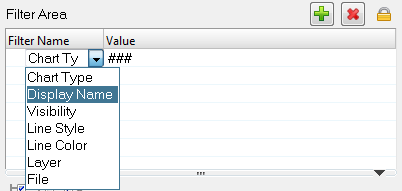
 , to add a filter to
the Filter Area.
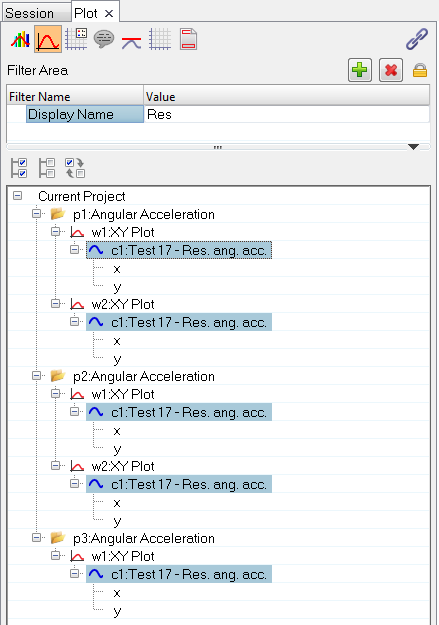
 .
.
 .
.