HS-1710: Simple Optimization Study
Learn how to optimize a simple function defined using a Templex template.
The base input template defines two input variables, DV1 and DV2, labeled X and Y, respectively. The objective of the optimization is to minimize X + Y with the constraint 1/X + 1/Y – 2 < 0.
Run Optimization
-
Add an objective.
- Click Add Goal.
- In the Apply On column, select Response 1 (r_1).
- In the Type column, select Minimize.

Figure 1. -
Add a constraint.
- Click Add Goal.
- In the Apply On column, select Response 2 (r_2).
- In the Type column, select Constraint.
- In column 1, select <= (less than or equal to).
- In column 2, enter 0.0.
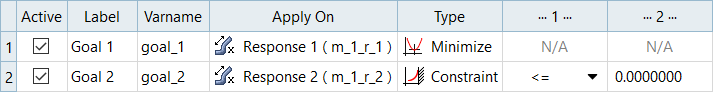
Figure 2. -
After the optimization has finished, review the optimization history
first.
-
Click the Iteration History tab to review the
iteration history.
With many of the algorithms (SQP, GA, …), each iteration requires many evaluations. Evaluation (plots or tables) show all runs performed during the optimization. Iteration (plots or tables) show the optimization iterations.
The Iteration History tab uses color coding to indicate which design are feasible, optimal, and violated.- White background/black font indicates the design is feasible.
- White background/red font indicates the design is violated.
- White background/orange font indicates the design is acceptable, but at least one constraint is near violated.
- Green background/white font indicates the design is optimal.
- Green background/orange font indicates the design is optimal, but at least one constraint is near violated.
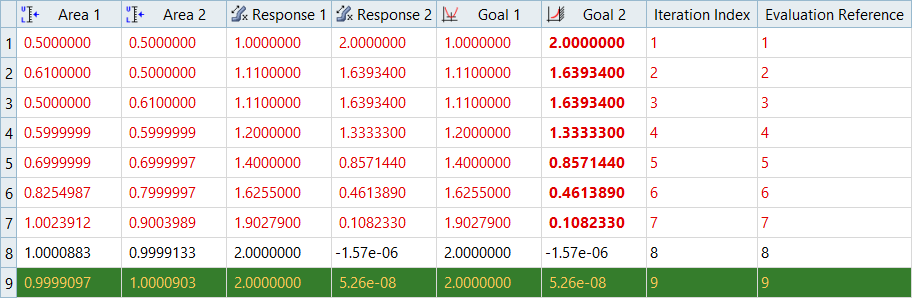
Figure 3. -
Click the Evaluation Plot tab to plot charts for
all of the entities in the optimization (input variables, output
responses, objective functions, constraints) against the
iteration.
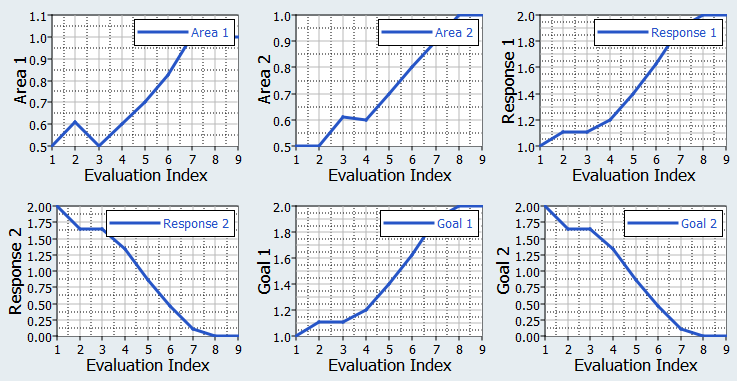
Figure 4.
-
Click the Iteration History tab to review the
iteration history.
Post Process Results
In the Post-Processing step of an Optimization approach, you can access additional tools to review the results. Use the Integrity, Distribution, and Scatter tabs to compare and analyze designs.
-
Click the Integrity tab to analyze statistics of the
optimization study.
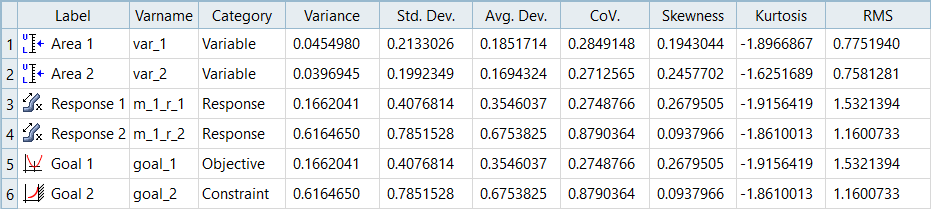
Figure 5.