Measure
Use the Measure tool to measure various distances and angles between entities.
- Distance between nodes or systems (markers)
- Minimum distance between two entities (nodes, components, or elements)
- Incremental distance between nodes or systems (markers)
- Position of x, y, z coordinates at any given time frame (nodes or systems/markers)
- Relative displacement of nodes or systems (markers)
- Relative angle between two nodes or systems (markers)
- Incremental angle between two nodes or systems (markers)
- Angle between three nodes or systems (markers)
- Yaw, pitch, and roll of systems (markers)
- Element or nodal results when contour data is applied
- Path between two (or more) nodes
- Radius of a circle defined by three nodes or systems
Measures can also be defined on cross-section nodes for measuring position, distance between, or any other nodal measure type to examine the points on the deformed section. Calculating intrusion on a vehicle cross car section of the B-pillar is an example for automotive crash simulations that will be applicable. In addition, nodal results can be measured on cross-sections and paths defined to study the variation of a result, as blank thickness from stamping simulations, using the path measures. See the Cross-Section Measurements and Path Plots topic for additional details.
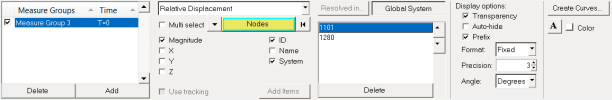
Figure 1. Measure Panel
Measure groups are displayed in the Measure Groups list. You can add and delete measure groups from the list. Check boxes allow you to activate/deactivate a measure group. You can also sort the items in the Measure Groups list by clicking on one of the list headings. In addition, keyboard shortcuts and a context menu are available for items within the list.
When a measure group is activated, it is included in the measure calculations and displayed on the screen. For each relative displacement or relative angle, the time step at which the measure was created is displayed as a reference. The definition of the currently selected measure group is displayed in the definition window.
- Static MinMax Result
- Displays the minimum and maximum values from all the time steps combined.
- Dynamic MinMax Result
- Displays the minimum and maximum values at each time step.
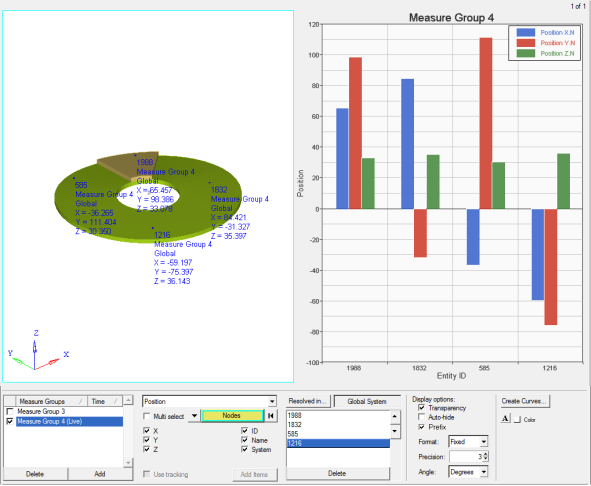
Figure 2. Example - Measure Group with a Bar Chart