Build Plots

Use the Plots tool to construct multiple curves and plots from a single result file.

Curves can be overlaid in a single window or each curve can be assigned to a new window.
From the Annotations toolbar, click Build Plots .
Note: You can also select Build Plots from the Annotations menu.


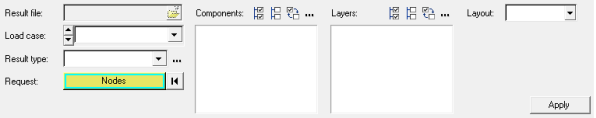
Figure 1. Build Plots Panel

Create a Curve or Plot

  1. From the Annotations toolbar, click Build Plots .
    The Build Plots panel opens.
    Note: The result file associated with the currently loaded model is displayed in the Result file field.
  2. Optional: Change the load case from the one currently displayed.
    • Use the Load case drop-down menu to make another selection from the expanded list.
    • Use the arrow up/down buttons to scroll through the other load cases available in the result file.
    Derived load cases are not listed.
  3. Select the result data type that will be used to construct the curve/plot.
    • Use the Result type drop-down menu to select one of the available result types. Derived results created within the session are not listed.
    • Click to open the Choose From List dialog to quickly view, sort, filter, and select from an expanded list of the available result types.
    Note: The list of available options will change depending on the currently loaded result file.
  4. For Request, pick one or more entities from the model to be used when creating a curve or plot.
    • Click the Nodes, Elements, or Components input collector and use the extended entity selection menu. See the Selecting Entities Using the Input Collector topic for more information on selecting entities.
    • Pick entities directly from the modeling window using the quick window selection method.
    Note: For MBD models, Systems (or Markers) can also be selected. Selection will be available if the results file has any type of results that are bound to Systems/Markers (forces or moments for example).
  5. Under Components, choose the data component type(s) to be plotted.
    • Use the All, None, Reverse buttons to select/deselect the components listed in the current view.
    • Click to open the Components dialog to quickly view and select from an expanded list of the available components.
    The list of available components is based on the selected result type. For example, Mag, X, Y, and Z components are available for the Displacement result type.
  6. Under Layers, choose the component layer(s) (if layer definitions are available for a selected component) to be displayed in a curve/plot.
    • Use the All, None, Reverse buttons to select/deselect the layers listed in the current view.
    • Click to open the Layers dialog to quickly view and select from an expanded list of the available layers.
    The list of available components is based on the selected component. For example, layers Z1 and Z2 are available for a Stress/vonMises result type/component selection.
  7. Specify how the plotted data is arranged on the page using the Layout drop-down menu options.
    Option Description
    One Plot Per Request Each selected request (entity) is plotted in a new plot with the corresponding components overlaid.

    For example, if two requests/entities (nodes, elements, or components) and two components (data component types like Mag or Z1) are selected, two plots are created (one for each selected entity) with two curves in each plot.

    One Plot Per Component Each selected component is plotted in a new plot.

    For example, if two requests/entities (nodes, elements, or components) and four components are selected, four plots are created with two curves in each plot.

    One Curve Per Plot Each curve is plotted in a new plot.

    For all plotting options, a new page is created. When the plots are built, each window on the new page is filled. If more windows are required, another page of the same layout is created.

    New window The curve is created in the next available empty window. If no such window exists, then the page layout is changed to the layout with an empty window. If no empty window is found, then a new page is added.
    Existing XY Plot

    *Existing Complex Plot

    The curve is created in an existing "xy" or "complex" plot window that was selected from the page and window tree.
    Note: The Existing Complex Plot option is only available if complex results are associated with the currently loaded model/results file.
       
  8. Click Apply.
    The selected options are applied to the model and all of the curves are constructed at once.
    Tip: Axis labels, plot titles, and page names are automatically generated, however they can be edited in HyperGraph using the Axes and Headers and Footers panels and the Session Browser.
    Note: Plots can contain up to six horizontal and six vertical axes. All curves created using the Plots tool are automatically assigned to the primary horizontal and vertical axes.