For each tire event, a report is generated. These reports are automatically created
using templates. You can also create your own templates for reports or plot the
signals/outputs in HyperGraph.
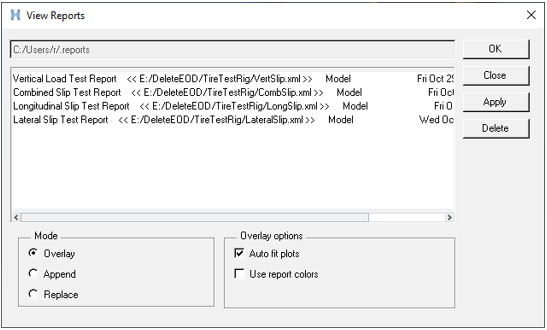
Like any other report in MotionView, these can also be accessed from: Analysis > View Report, after the event is exported and executed in MotionSolve.
Figure 1. Plotting Reports
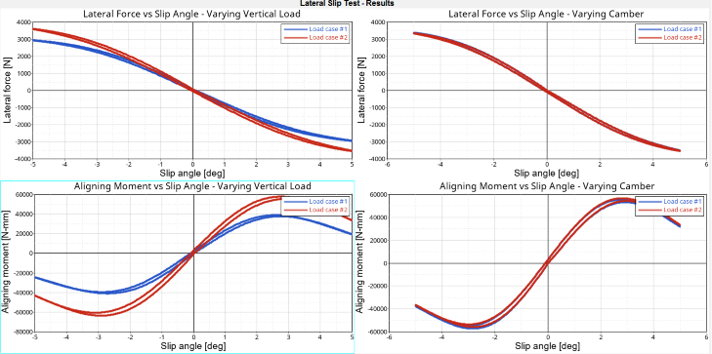
Lateral Slip Test
The lateral slip test reports have the following pages:
Animation
Raw signals from the event
Cross plots of: Lateral Force and Aligning Moments vs Slip angles for
various vertical loads and camber angles as specified in the event.
Figure 2. Lateral Slip Test - Cross Plots
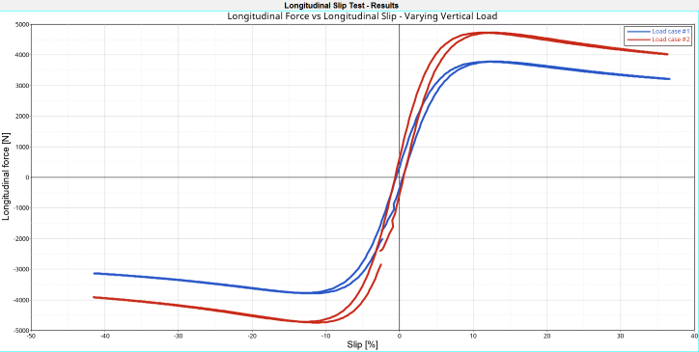
Longitudinal Slip Test
The longitudinal slip test reports have the following pages:
Animation
Raw signals from the event
Cross plots of: Longitudinal Force and Longitudinal Slip for various
vertical loads as specified in the event.
Figure 3. Longitudinal Slip Test - Cross Plots
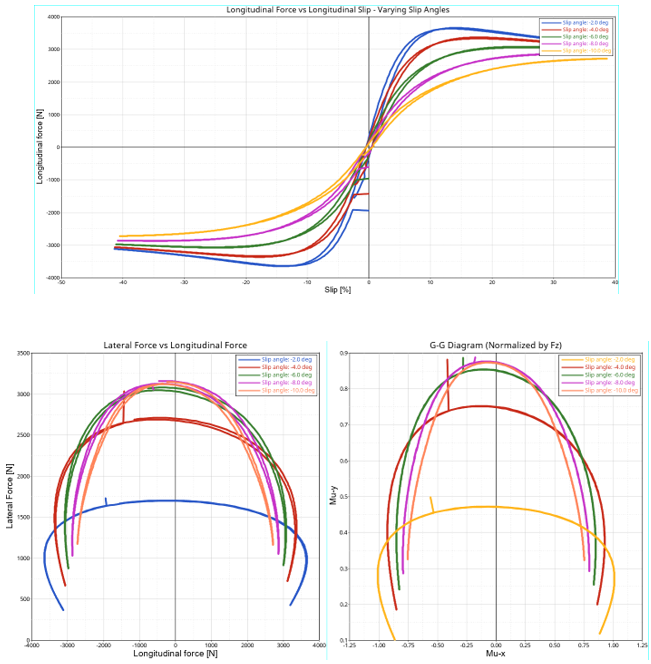
Combined Slip Test
The combined slip test reports have the following pages:
Animation
Tire Forces
Slip Values - Lateral and Longitudinal
Cross Plot: Longitudinal Force vs Longitudinal Slip
Cross Plot: Lateral Force vs Longitudinal Force and Normalize Plots
Figure 4. Combined Slip Test - Cross Plots
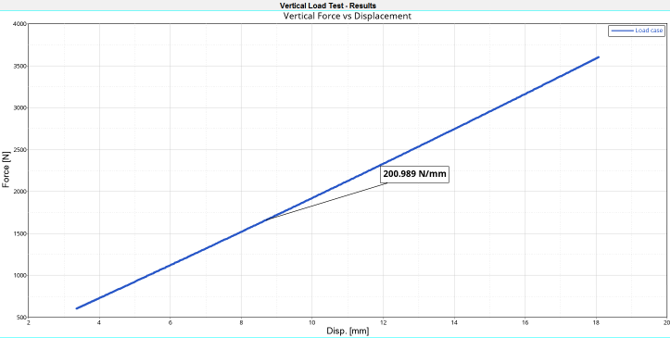
Vertical Load Test
The vertical load test reports have the following pages:
Animation
Raw signals from the event
Cross plots of: Tire Contact Patch Force [Z] vs Wheel Center
displacement.