This POSTFEKOアプリケーションマクロ can be used to plot all the standard parameters that are available after a characteristic mode analysis simulation
was performed.
This アプリケーションマクロ is used for calculating mean effective gain (MEG) and envelope correlation coefficient (ECC) for a MIMO antenna configuration.
The MEG ratio can also be plotted.
The Multiport post-processingアプリケーションマクロ allows you to calculate results for changes in the port loading without rerunning the ソルバー. Results that are supported are far fields, near fields, currents and specific port parameters, for example,
the voltage, current and S-parameters of each port.
The characteristic mode synthesis and design アプリケーションマクロ is a post-processing アプリケーションマクロ that can be used to calculate a weighted sum for the currents, near fields, and far fields requests for specific
characteristic modes of interest. The アプリケーションマクロ uses a modified version of the modal weighting coefficient (MWC) to use the radiating phase when synthesising
the results with the macro.
Characteristic mode analysis (CMA) is the numerical calculation of a weighted set of orthogonal current modes that
are supported on a conducting surface. The sets of characteristic near fields and far fields associated with these
characteristic currents can provide insight into the radiating properties of structures, allowing for a systematic
approach to antenna design and placement.
The characteristic mode synthesis and design アプリケーションマクロ is a post-processing アプリケーションマクロ that can be used to calculate a weighted sum for the currents, near fields, and far fields requests for specific
characteristic modes of interest. The アプリケーションマクロ uses a modified version of the modal weighting coefficient (MWC) to use the radiating phase when synthesising
the results with the macro.
The example illustrates the synthesis method of the アプリケーションマクロ. Optionally, the design method can be used to specify a
custom weighting coefficient.
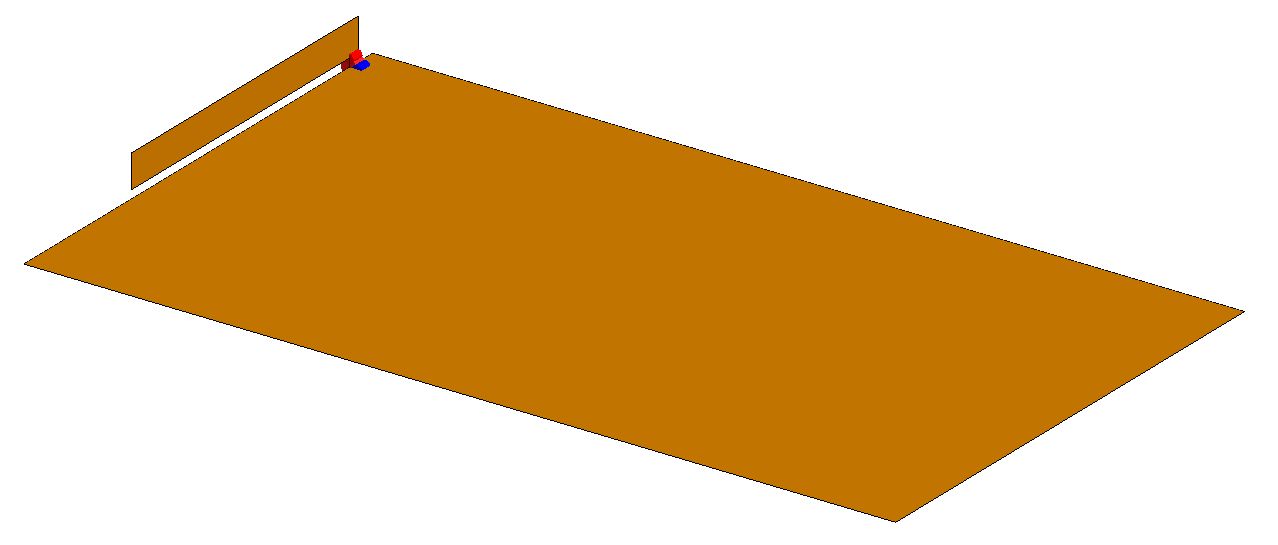
An example of the antenna and plate model is shown below. The antenna is excited at the
corner of the plate with a voltage source; for this example, the frequency range is 700
MHz to 960 MHz.
Tip: Find the examples in the <FEKO_SHARED_HOME>
directory:
The model is set up with a CMA configuration and the following requests:
A CMA request with 20 modes and the Compute modal excitation
coefficients check box is selected.
A far field request with the default 3D pattern.
A current request calculating all the currents on the structure.
An additional standard configuration with the same far field and current requests
is added to compare the weighted sum results with the full モーメント法 (MoM) solution.
Note: Use the CMA plotter アプリケーションマクロ to plot CMA quantities and to determine the
dominant modes at the frequency of interest.
Using the Macro
Execute the CM_synthesis_and_design.luaアプリケーションマクロ in POSTFEKO to calculate the weighted sum for the characteristic modes of interest.