Tutorial: Design of Experiments
Learn how to create a DOE and explore the results.
- Review fully defined geometric variables
- Create a DOE and activate the variables
- Adjust and review the design variables
- Create a response
- Run a DOE
- Review run results before the DOE is complete
- Explore the DOE run results
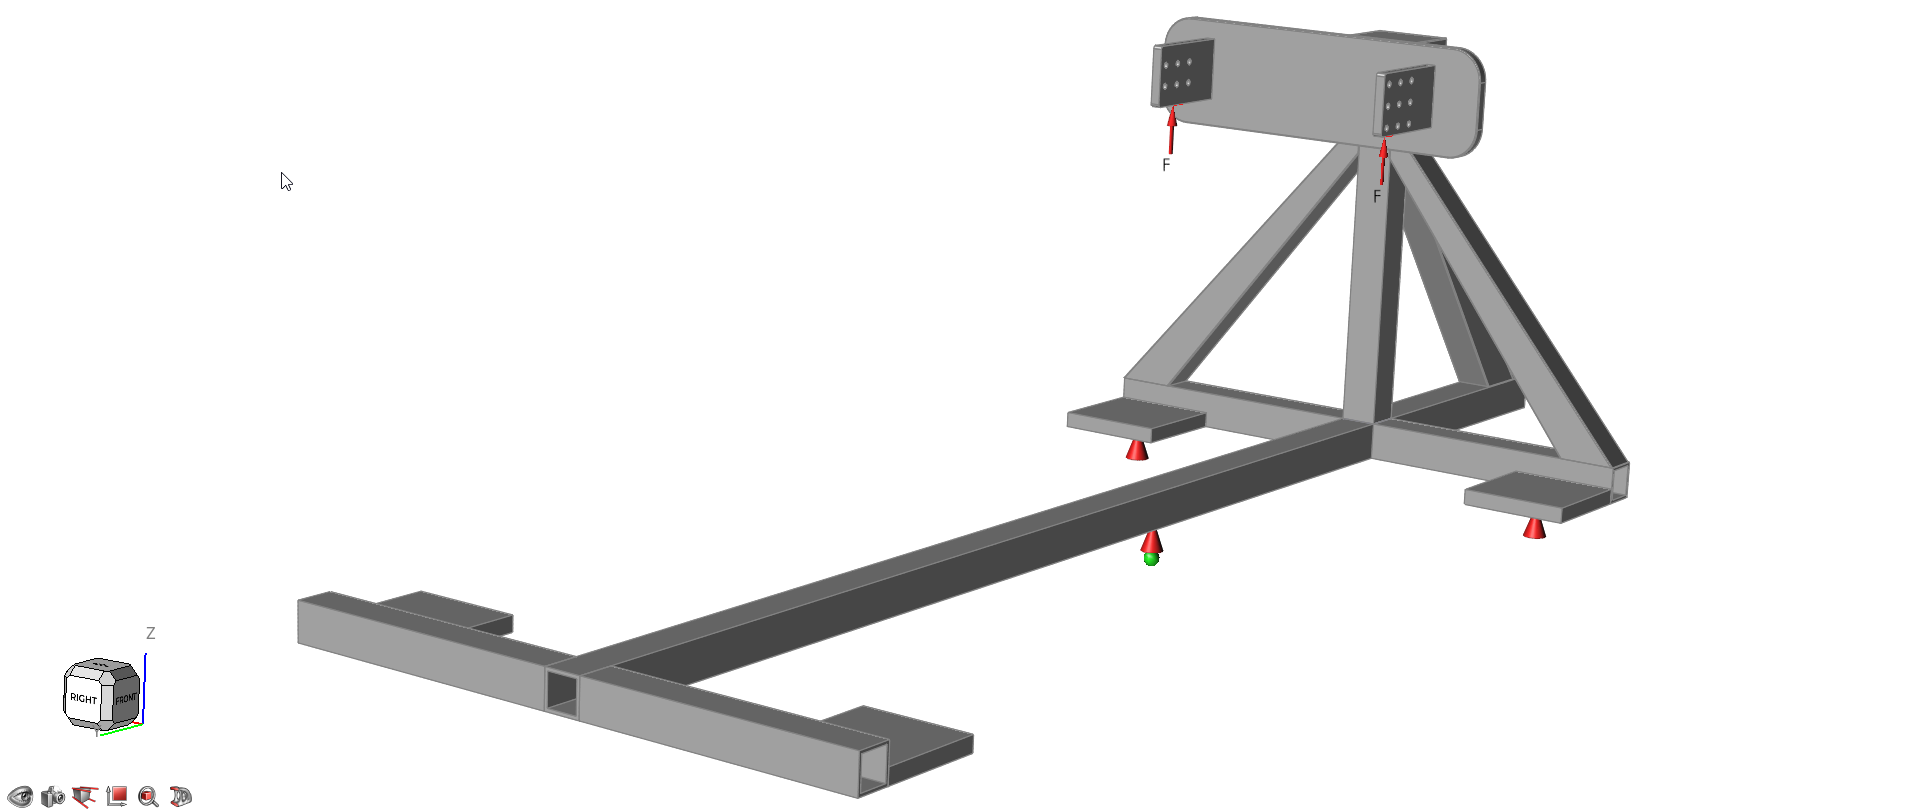
Open the DOE Model
-
Browse to the Design_Explorer_DOE_Fixture.stmod
file.
The model is loaded.
-
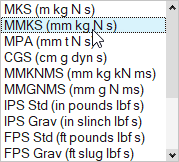
In the lower right corner of the modeling window, set the display units to
MMKS (mm kg N s).
Review Fully Defined Geometric Variables
-
On the Geometry ribbon, select the Variables tool.

The Variable Manager is displayed.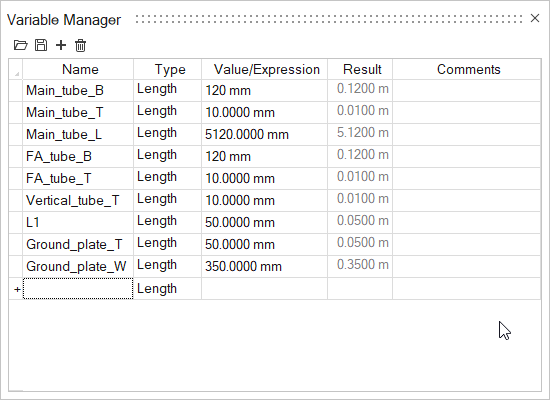
These variables were generated when sketching. It is best practice to make sure that all parts are fully constrained in the model when creating geometric variables. For details on how to create variables, see Video Tutorial: Creating a Parametric Part.
-
Press F6 to open the Construction History Browser.
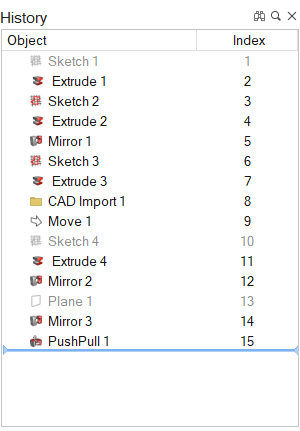
-
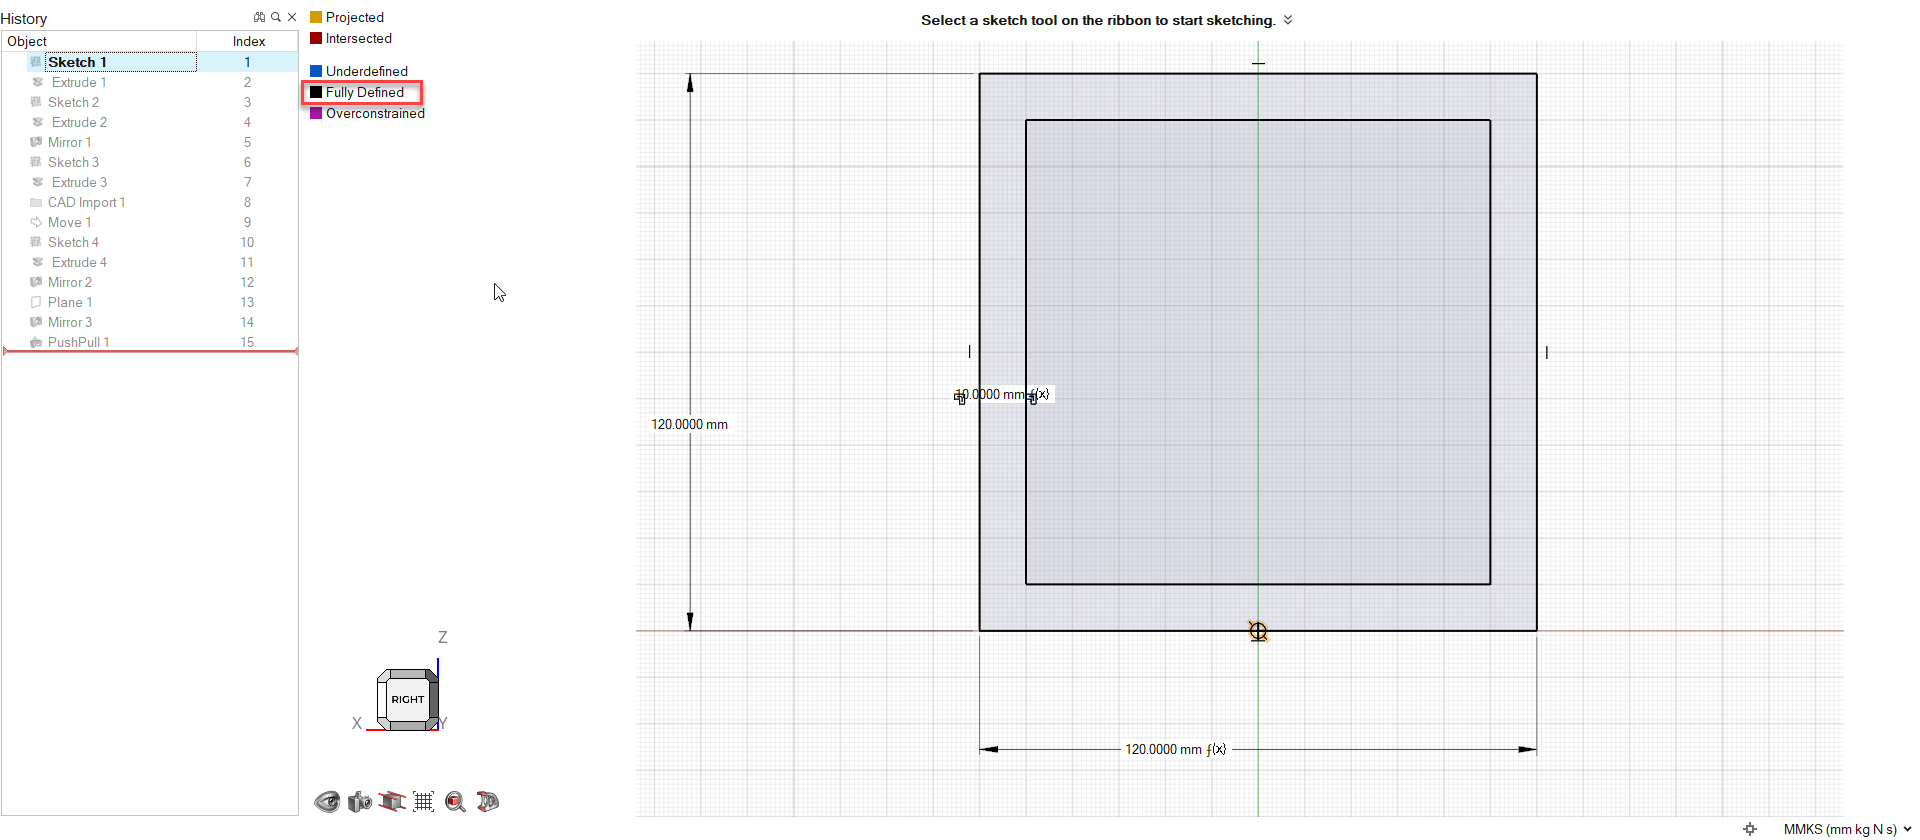
Double-click Sketch 1. The sketch is black, indicating
that it is Fully Defined.
Create a DOE and Activate the Variables
-
From the Design Explorer ribbon, select the Explorations
tool.

All geometric variables that are not linked to other variables are automatically converted to Design Variables.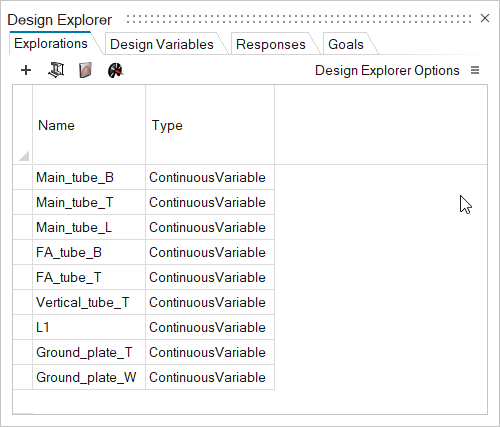
-
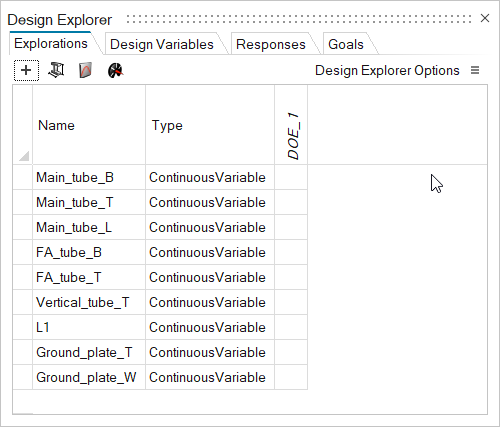
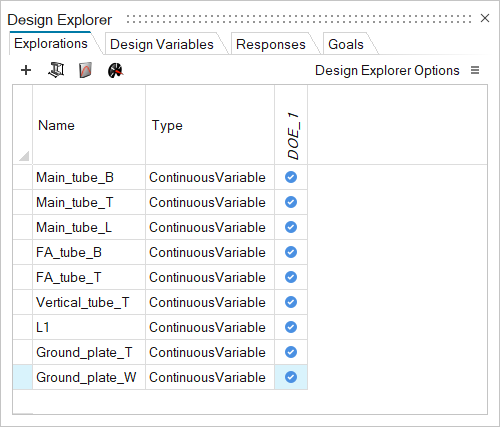
On the Explorations tab, click + Add Exploration, and
then select DOE.
An active DOE is created.
-
Under DOE_1, select the empty cells to activate all
variables.
Adjust and Review Design Variables
-
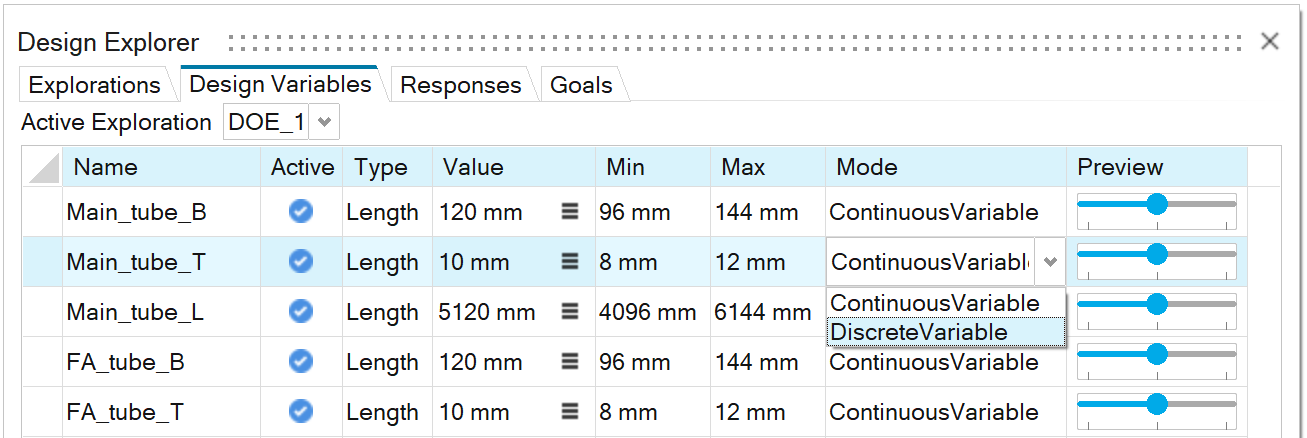
On the Design Explorer ribbon, select the Design
Variables tool.

Min and Max values are automatically generated from the initial variable values. Main_tube_B=120 mm + 22.2% yields Min=96 mm and Max=144 mm. -
For Main_tube_T , change the Mode
to Discrete Variable.
-
In the Main_tube_T row, Value
cell, select
 for more options.
-
Turn on Step Size, and then enter
.5.
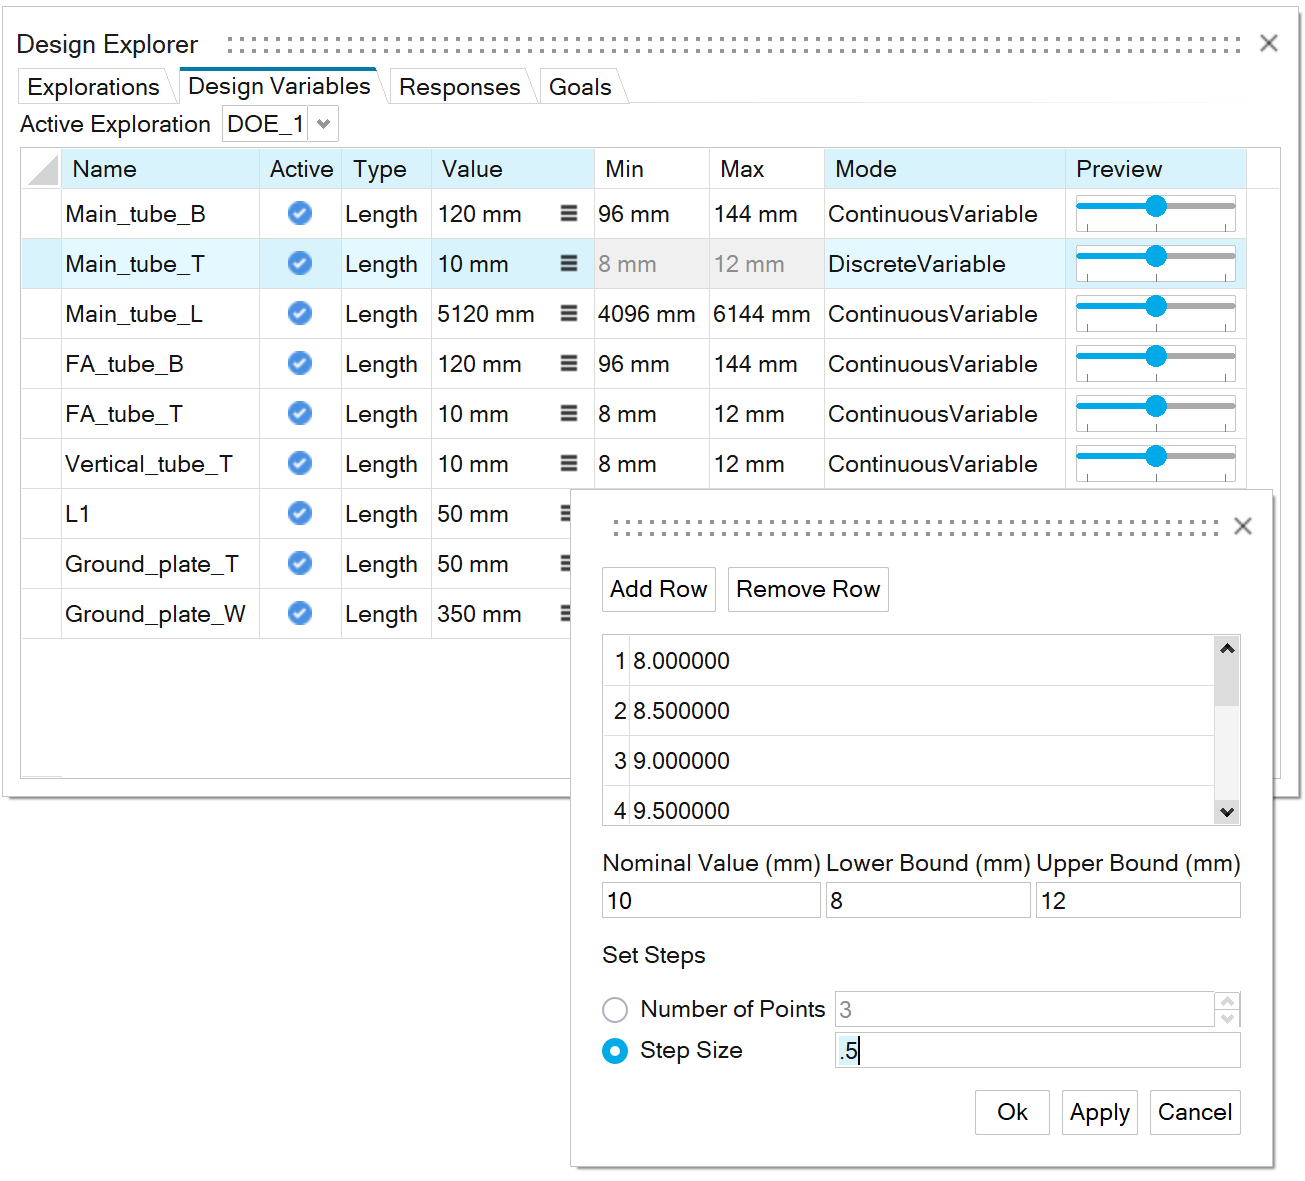
You have now set the Length of Main_tube_T to discrete increments of 0.5 mm between 8 and 12 mm.
-
Turn on Step Size, and then enter
.5.
Create a Response
-
From the Design Explorer ribbon, select the Responses
tool.

-
On the guide bar, click
 to create the response and exit the tool.
This creates a maximum displacement response of the entire model.
to create the response and exit the tool.
This creates a maximum displacement response of the entire model.
Run a DOE
-
From the Design Explorer ribbon, Evaluate tool group, click the
Evaluate tool.
 The Evaluate dialog opens.
Review Completed Runs While the DOE Is in Progress
-
You can do the following:
To Do this Review run results In the Status column of the Run Status dialog, double-click a completed run. Display run errors In the Status column of the Run Status dialog, mouse over a failed run to display a possible error message. Review error logs In the Run Status dialog, right-click a failed run, and then select Open Run Folder. 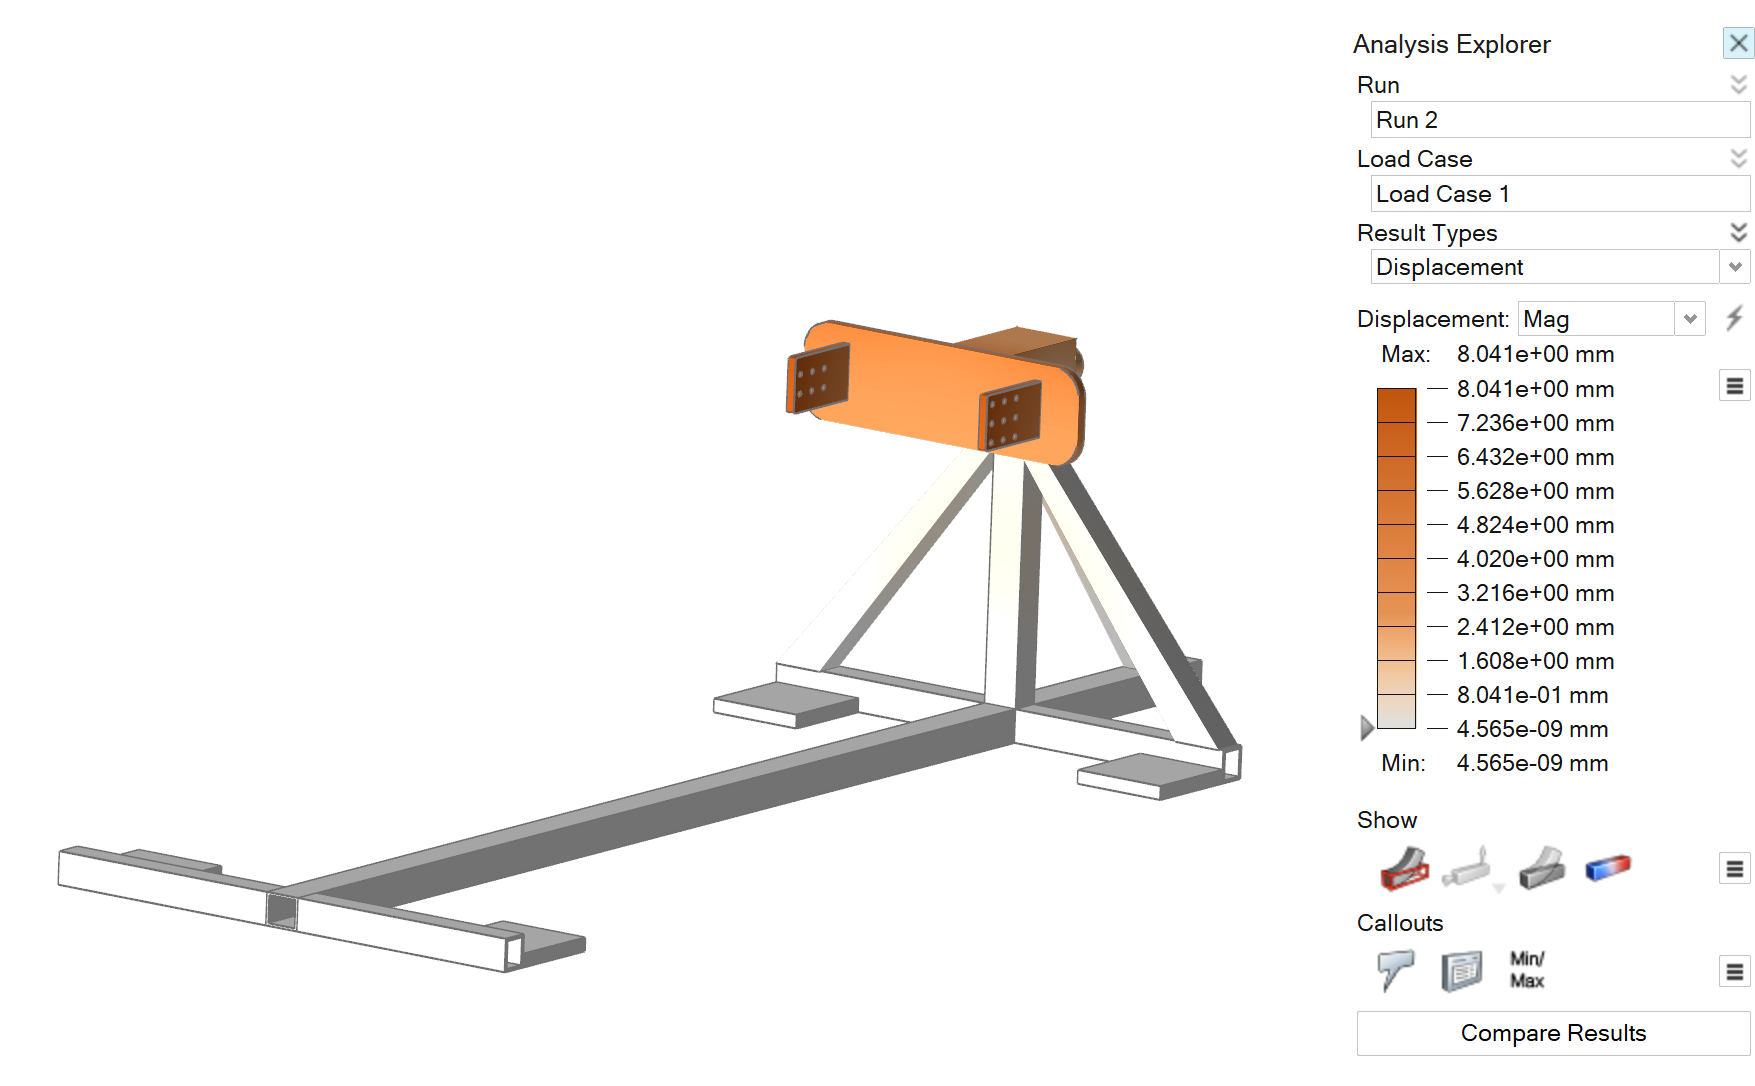
Explore the DOE Run Results
-
From the Design Explorer ribbon, select the Results
Explorer tool.

The Results Explorer browser opens.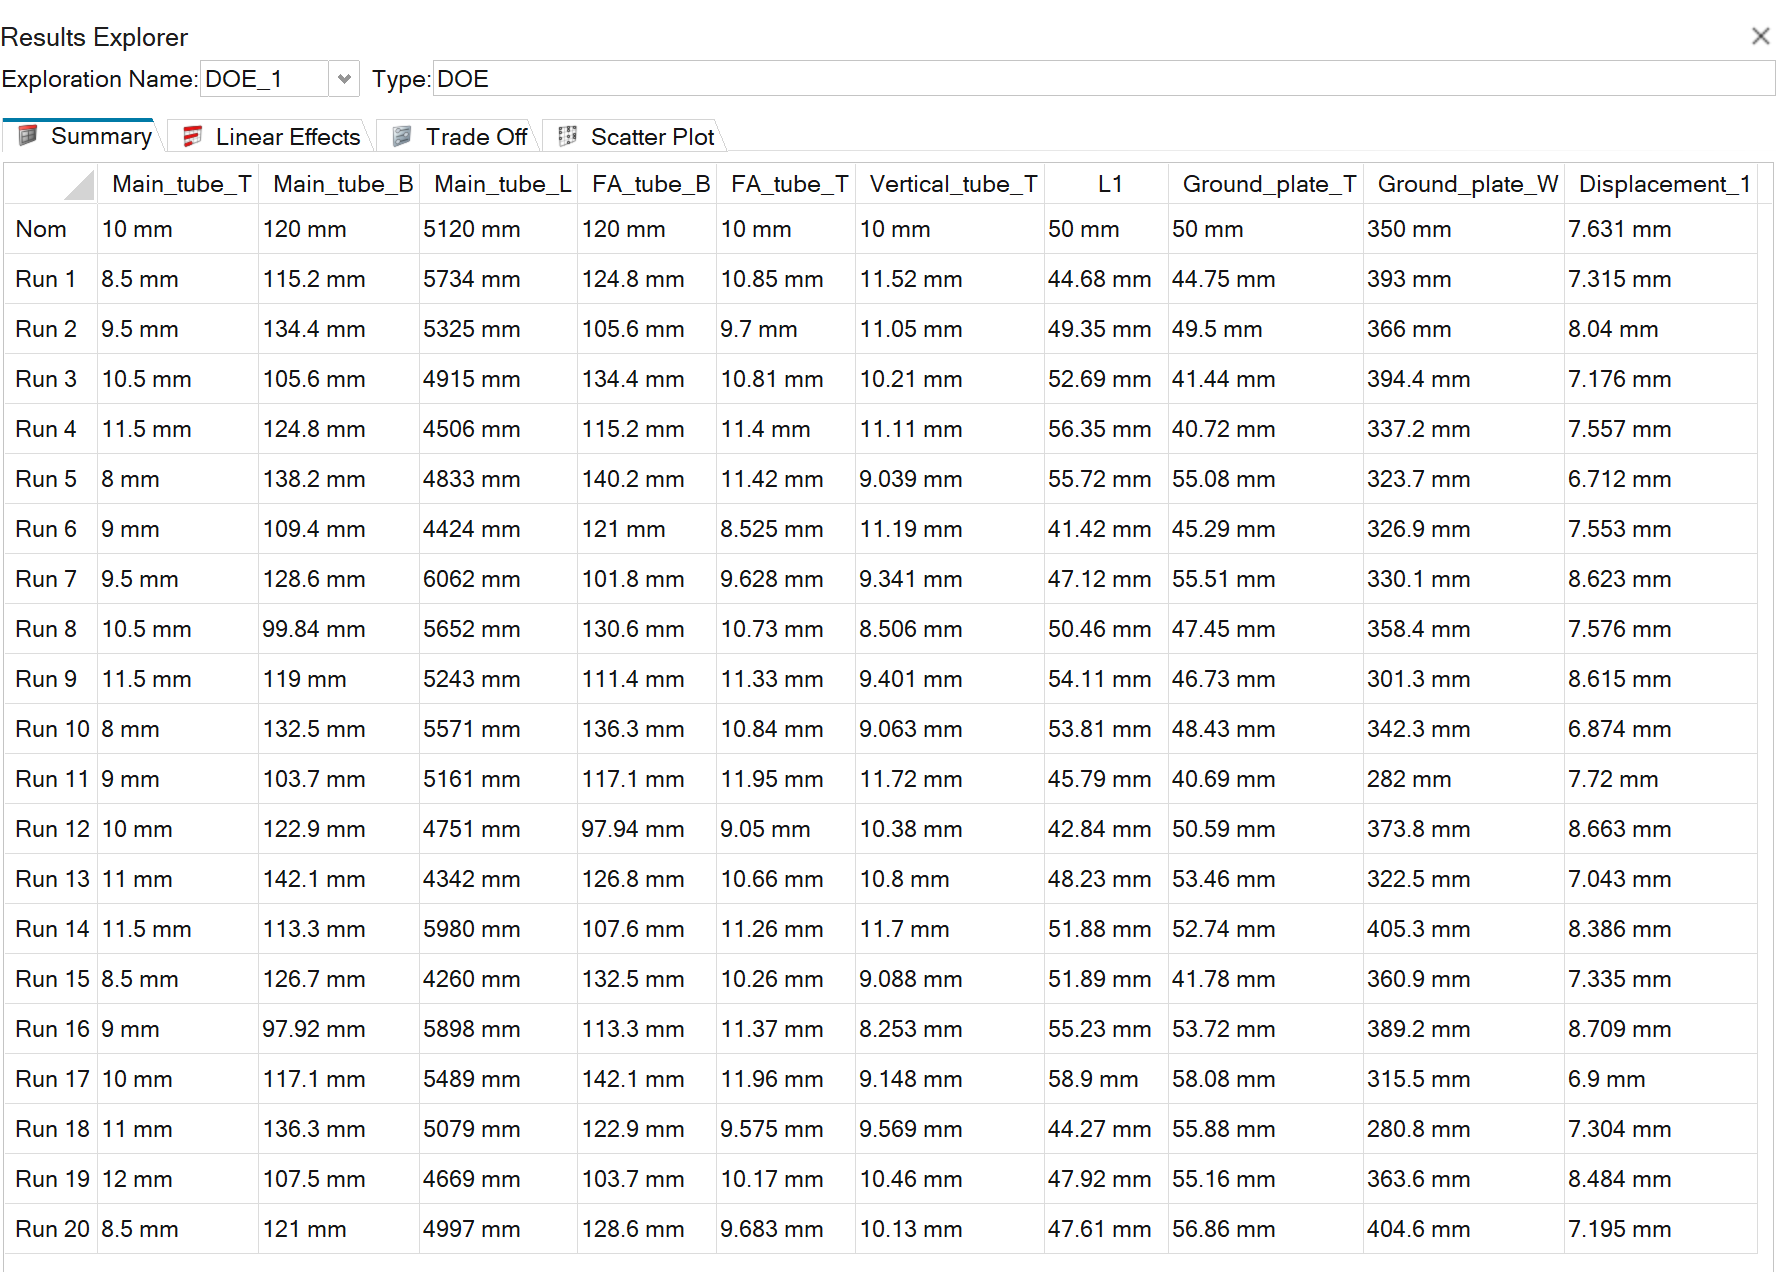
There are 4 tabs of results: Summary, Linear Effects, Trade Off, and Scatter Plot. -
Select the Summary Table
 tab.
The Summary Table shows a run-by-run summary of the exploration. The columns show the input design variable values for each run and the corresponding response values. For more information, see Summary Table.
tab.
The Summary Table shows a run-by-run summary of the exploration. The columns show the input design variable values for each run and the corresponding response values. For more information, see Summary Table. -
Select the Linear Effects
 tab.
The linear plot shows the relative effect that a design variable has on the model for a selected response. The larger the number, the larger the impact of the given variable, relative to the other variables. The coloring of the effects indicates whether a given effect has a positive or negative effect.
tab.
The linear plot shows the relative effect that a design variable has on the model for a selected response. The larger the number, the larger the impact of the given variable, relative to the other variables. The coloring of the effects indicates whether a given effect has a positive or negative effect.Positive effects are shown in shades of blue and indicate that a positive change in the design variable results in a positive change on the response.
Negative effects are shown in shades of brown and indicate that a positive change in the design variable results in a negative change on the response. FA_Tube_B has a linear effect of -2.021, meaning an increase in the tube base width will decrease the displacement response. The full linear effect from the minimum design variable of 96 mm to the maximum design variable of 144 mm would be approximately -2 mm.
For more information, see Linear Effects.
-
Select the Trade Off
 tab.
Trade Off allows you to predict response values resulting from different design variables regardless of whether they were run using the linear effect calculations. In this case, you can set any variable within the range and get a calculated response value. For more information, see Trade Off.
tab.
Trade Off allows you to predict response values resulting from different design variables regardless of whether they were run using the linear effect calculations. In this case, you can set any variable within the range and get a calculated response value. For more information, see Trade Off. -
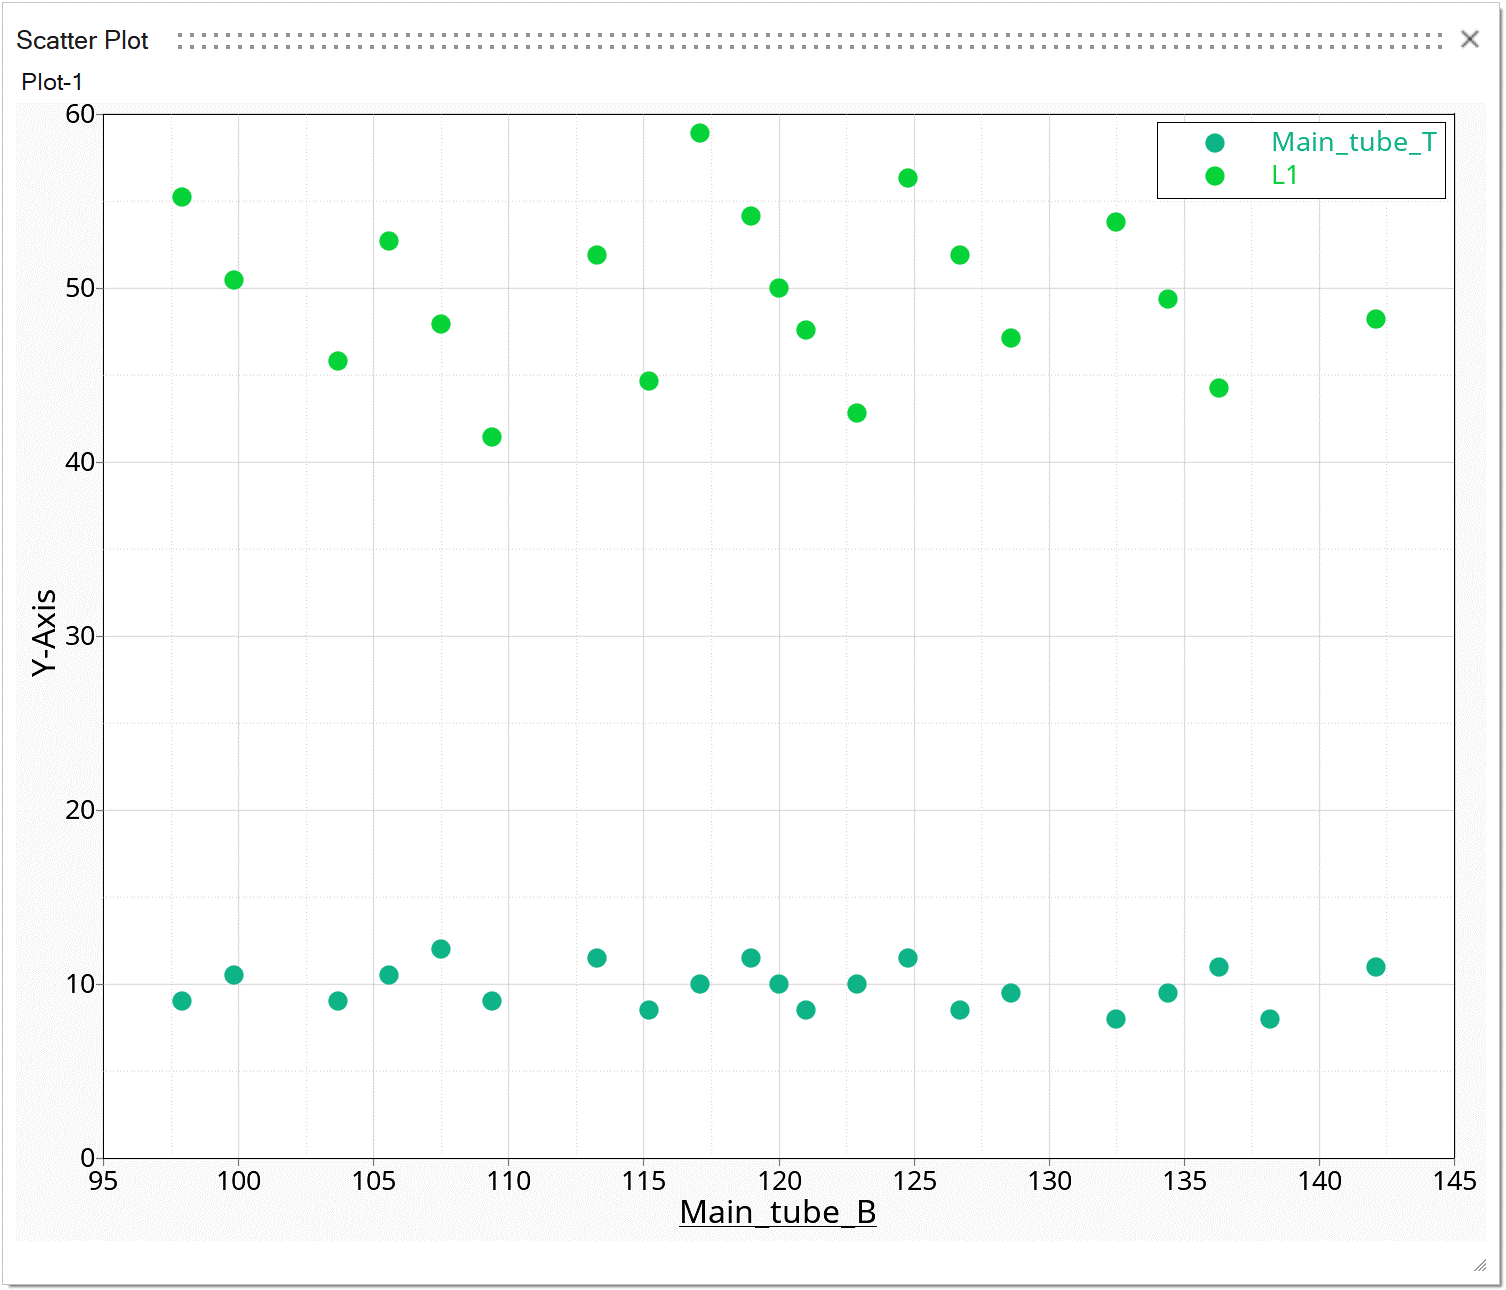
Select the Scatter Plot
 tab.
A scatter plot is a 2-dimensional plot showing trends or relationships between variables. For more information, see Scatter Plots.
tab.
A scatter plot is a 2-dimensional plot showing trends or relationships between variables. For more information, see Scatter Plots.