OS-T: 1000 Linear Static Analysis of a Plate with a Hole
This tutorial demonstrates the creation of finite elements on a given CAD geometry of a plate with a hole. Further, application of boundary conditions and a finite element analysis of the problem are explained. Post-processing tools are used in HyperView to determine deformation and stress characteristics of the loaded plate.
Launch HyperMesh and Set the OptiStruct User Profile
Open the Model
Set Up the Model
Create the Material
Create the Property
Update the plate_hole Component
Apply Loads and Boundary Conditions
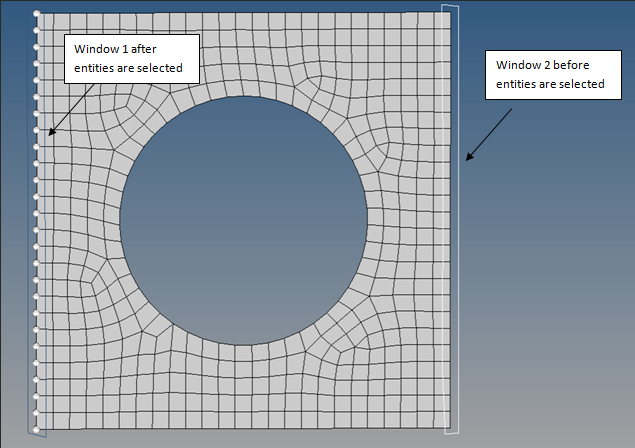
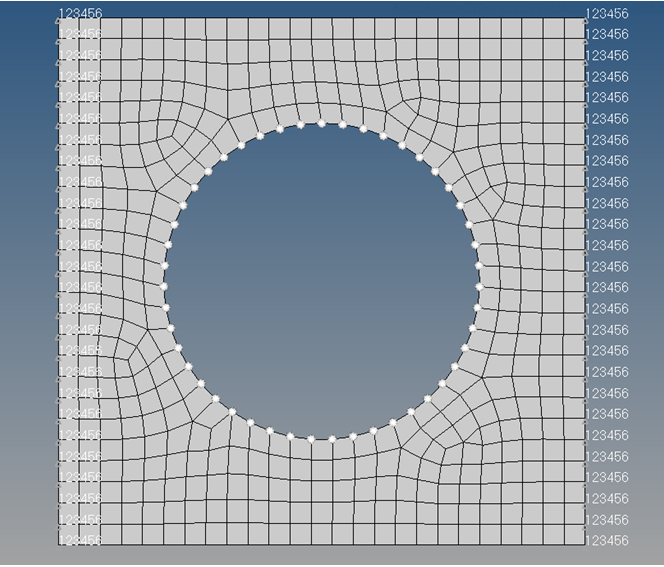
In the following steps, the model is constrained so that two opposing edges of the four external edges cannot move. The other two edges remain unconstrained. A total load of 1000N is applied at the edge of the hole in the positive z-direction.
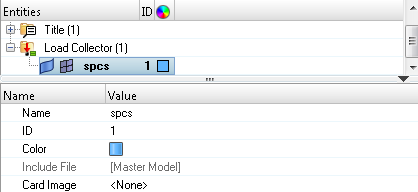
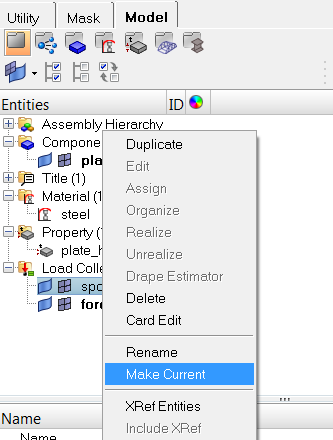
Create Load Collectors
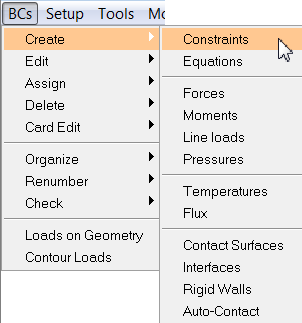
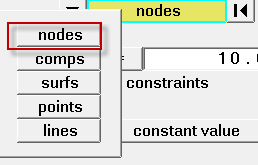
Create Constraints
Create Forces on the Nodes around the Hole
Create Load Steps
- In the Model Browser, right-click and select from the context menu.
- For Name, enter lateral forces.
- Set Analysis type to Linear Static.
-
Define SPC.
- For SPC, click .
- In the Select Loadcol dialog, select spcs and click OK.
-
Define LOAD.
- For LOAD, click .
- In the Select Loadcol dialog, select forces and click OK.
An OptiStruct subcase has been created which references the constraints in the load collector spcs and the forces in the load collector forces.
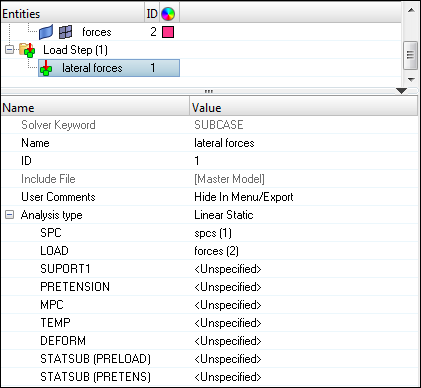
Figure 13. Creating the lateral forces Loadstep
Submit the Job
- plate_hole.html
- HTML report of the analysis, providing a summary of the problem formulation and the analysis results.
- plate_hole.out
- OptiStruct output file containing specific information on the file setup, the setup of your optimization problem, estimates for the amount of RAM and disk space required for the run, information for each of the optimization iterations, and compute time information. Review this file for warnings and errors.
- plate_hole.h3d
- HyperView binary results file.
- plate_hole.res
- HyperMesh binary results file.
- plate_hole.stat
- Summary, providing CPU information for each step during analysis process.
View the Results
Displacement and Stress results for linear static analyses are output from OptiStruct by default. The following steps describe how to view those results in HyperView.
HyperView is a complete post-processing and visualization environment for finite element analysis (FEA), multibody system simulation, video and engineering data.
View a Contour Plot of Stresses
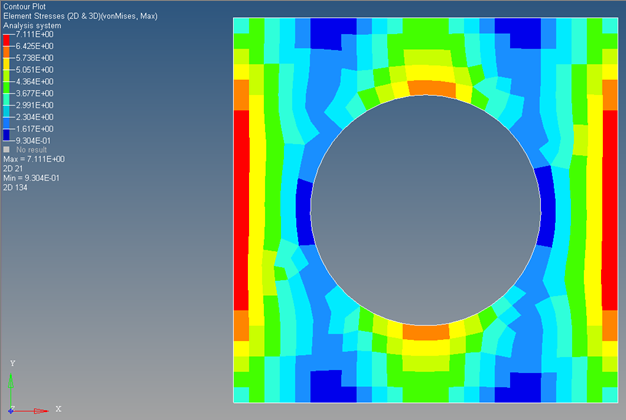
- What is the maximum von Mises stress value?
- At what location does the model have its maximum stress?
- Does this make sense based on the boundary conditions applied to the model?
View a Contour Plot of Displacements
- Under Result type set the first first pull-down menu to Displacement (v) and set the second pull-down menu to Mag.
- Click Apply.
- What is the maximum Displacement value?
- At what location does the model have its maximum displacement?
- Does this make sense based on the boundary conditions applied to the model?
View the Deformed Shape
- In the View Controls toolbar, click the Isometric View icon to display the isometric view of the model.
-
Click the Deformed toolbar icon
 .
.
-
Define settings in the Deformed panel.
- Click Apply.
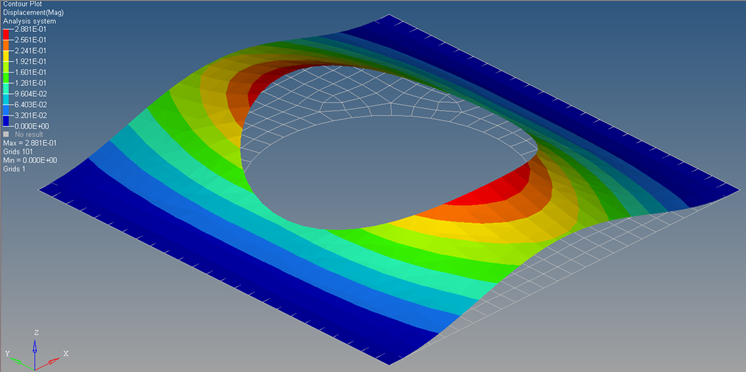
Figure 17. Isometric View of the Deformed Plot Overlaid on the Undeformed Mesh (Model Unit is Set to 500)





 to open the

