Tutorial: Low Pressure Die Casting
Learn how to simulate a stalk and set up a pressure curve for a low pressure die casting simulation.
Model file is available in the tutorial_models folder in the installation directory in Program Files\Altair\2022.3\InspireCast2022.3\tutorial_models\lowpressure.x_b.
Import Geometry
-
Click Open Model on the Files icon and browse to the
tutorial model file in the installation directory, or drag-and-drop the file
into the modeling window.

Designate a Casting Part
-
On the Cast Part icon, click Designate
Casting Part.

-
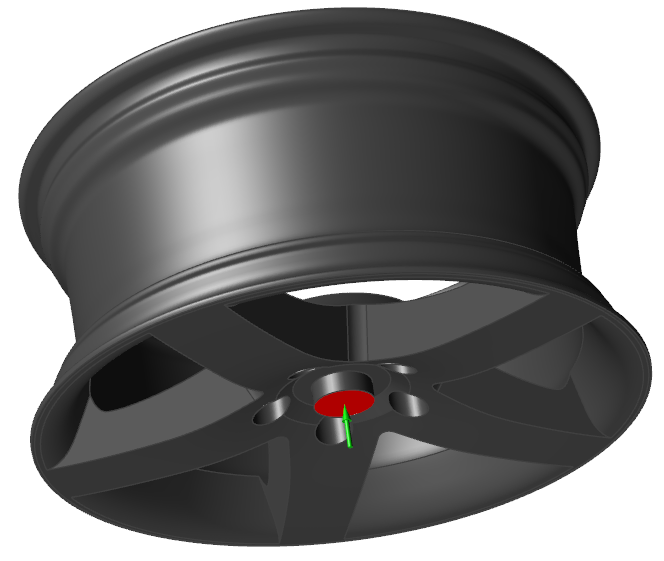
Left-click to select which candidate is a cast part.
Parts are automatically detected and highlighted based on your cursor position. Since there is a single geometry the entire cast part will be automatically highlighted.The selected part is highlighted red.

-
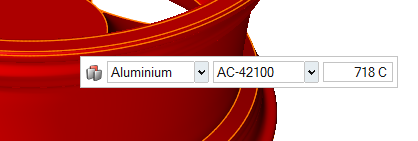
In the microdialog, select
Aluminum as the material, and
AC-42100 as the alloy for the part.
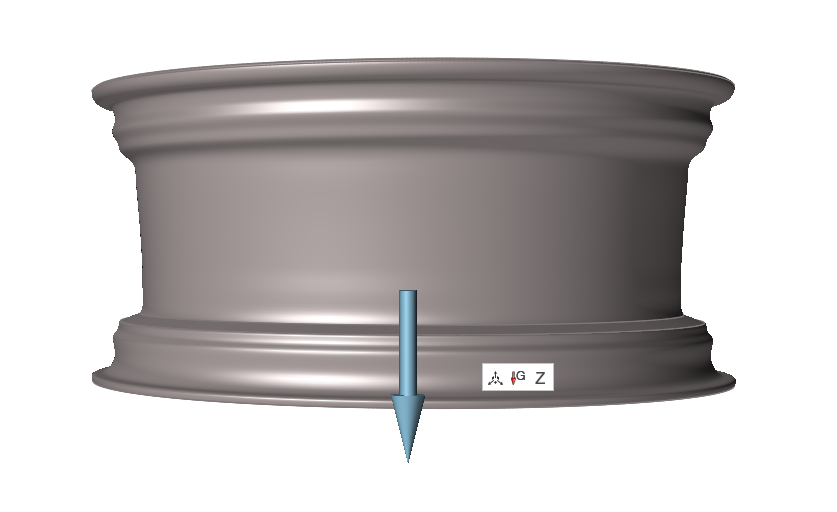
Set Gravity Direction
-
On the Cast Part tool, click Set Gravity
Direction.

-
Confirm that the part is correctly aligned with gravity.
Add a Mold
-
Click the Components tool.

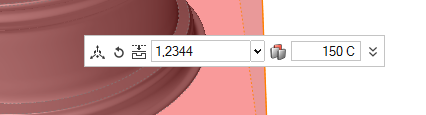
Click the Add/Edit Mold tool in the secondary tool group.
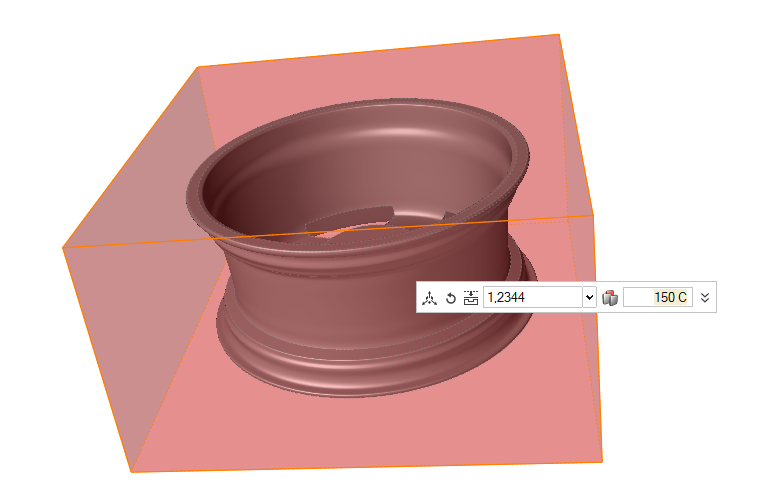
-
Select 12344 and enter 150 C.
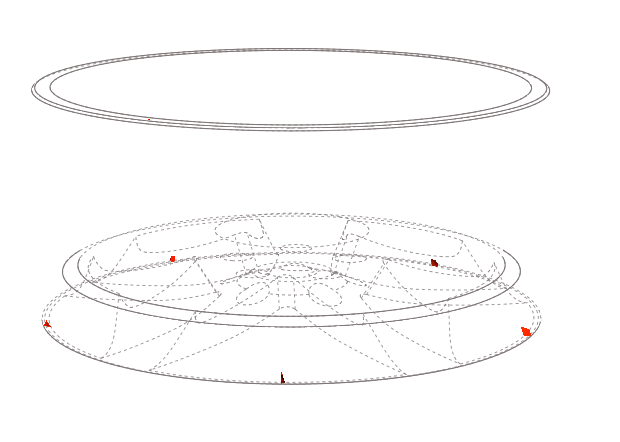
Designate the Gate
-
On the the Gate icon, click Designate
Surfaces as Gates.

-
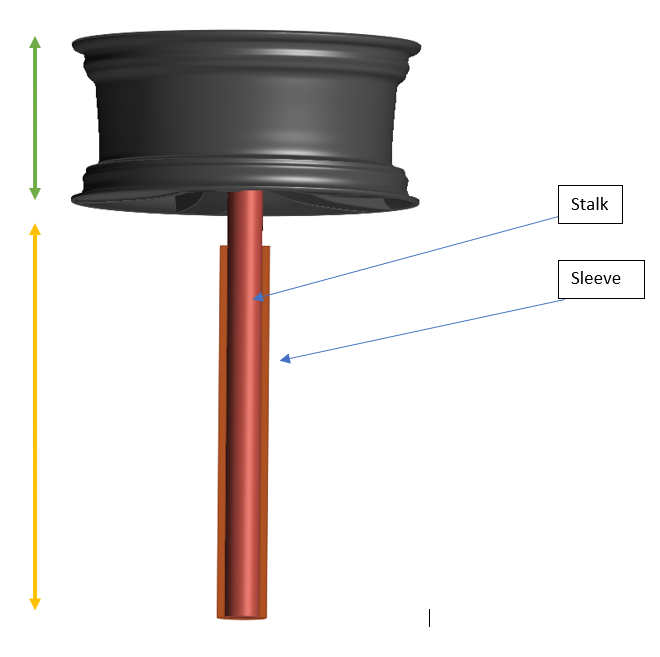
Click the bottom surface to create a gate where a stalk will be
simulated.
Note: Since there is only one gate, there is no need to use the features in the microdialog.
Define Process Parameters
-
Click
 to select the
Low Pressure icon.
to select the
Low Pressure icon.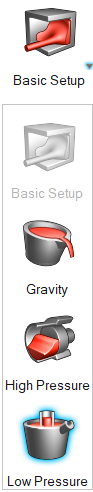
-
Ensure that the Use stalk checkbox is checked. In the
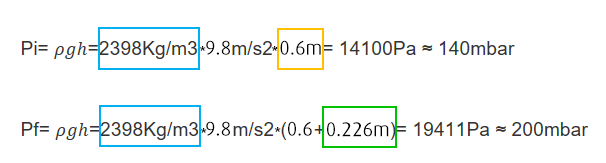
Distance field, enter a value of 600 mm. Plot the
values on the pressure curve as noted below:
Time (s) Pressure (mbar) 1 0.0 100.0 2 3.0 200.0 3 5.0 220.0 4 7.0 240.0 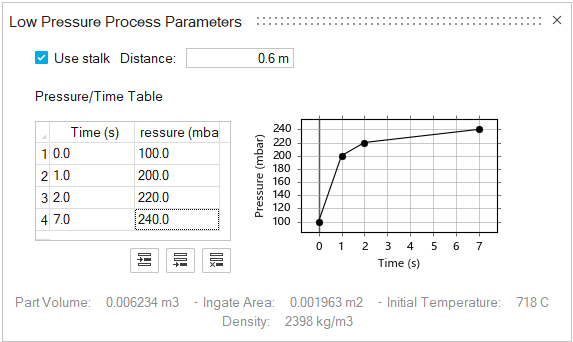
Note:- For the initial pressure, consider only the stalk length for the
height. For the final pressure, use the stalk length plus the height
of the part.
- The final time value is slightly greater than the expected filling time.
- For the initial pressure, consider only the stalk length for the
height. For the final pressure, use the stalk length plus the height
of the part.
Run Analysis
-
On the Analysis icon, click Run
Analysis.

-
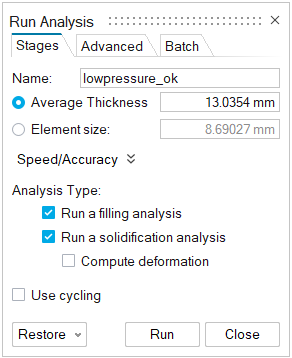
Enter an Average Thickness of 13.0354 mm. Ensure that
the Element Size is at least 8.69027 mm.
-
Click Run.
Note: Once the simulation calculation is finished, the green flag will appear on the analyze icon.

Note: The user can also select the results by clicking View Now under Run History.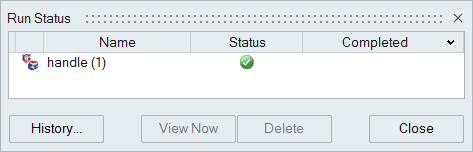
Analyze Results
-
Click Filling under Stage.
-
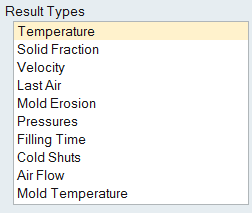
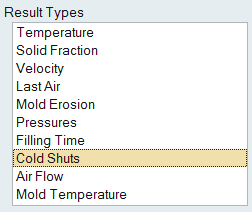
Click Temperature under Result
Types.
-
Click Play
to start the animation.

We can see how fluid is rising from the stalk to reach the wheel rim. This is the real simulation of the fluid inside the machine.
-
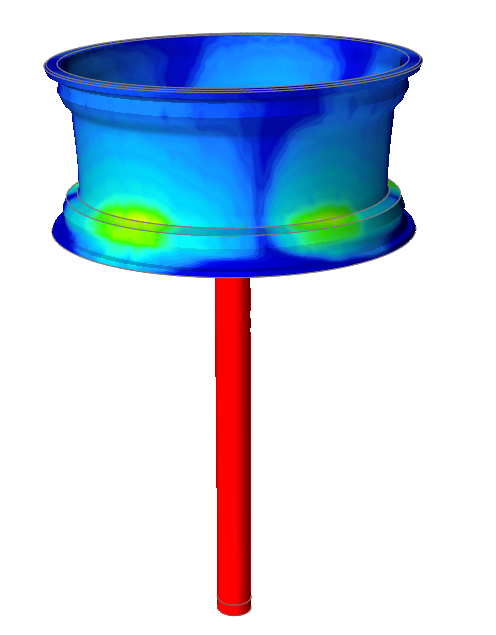
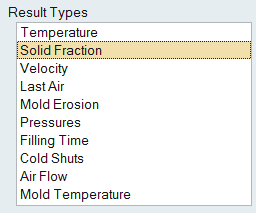
Click Solid Fraction under Result
Types.
-
Click Play
to start the animation.
Solid Fraction results allow you to determine if there will be any solid areas during filling. A value of 0 corresponds to a completely liquid material, while a value of 1 corresponds to a completely solid material.
This result shows that there are no solidified regions inside.
-
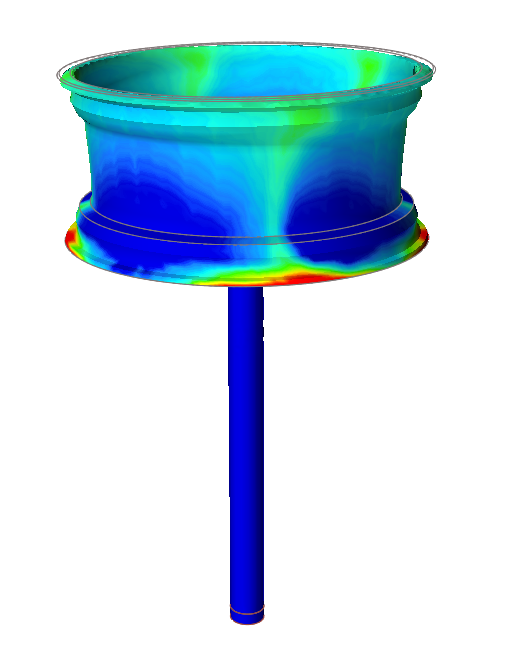
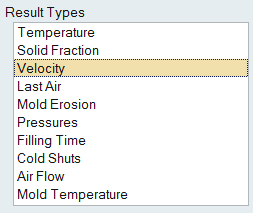
Click Velocity under Result
Types.
-
Click the Show/Hide Options hamburger icon
 . Select Vector Plot from the
menu.
. Select Vector Plot from the
menu.
-
Click Play
to start the animation.
We can observe turbulence at the union between the wheel and the stalk due to the high velocity (around 7 m/s). Based on this result, coupled with the knowledge that there are no problems of early solidification during filling, we could decide to decrease the pressure to fill the wheel more slowly and avoid this turbulence.
-
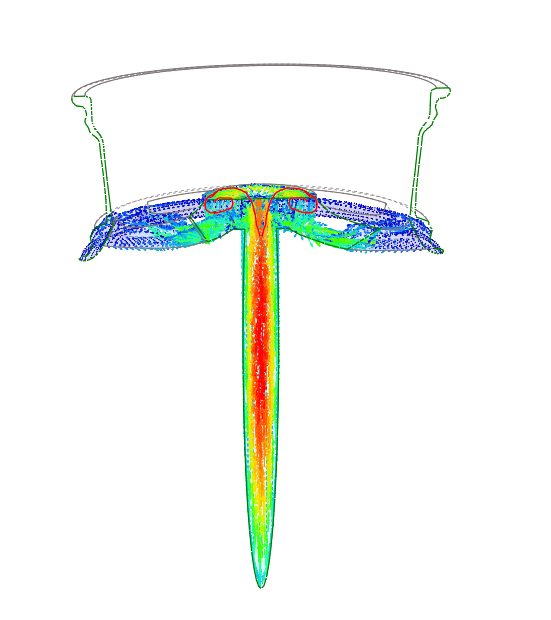
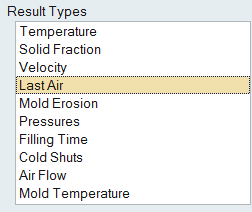
Click Last Air under Result
Types.
We can see here that most of the air inside the mold is being trapped at the top surface. There is a partition line there so the air will escape, but a flash defect will probably form in the region.
-
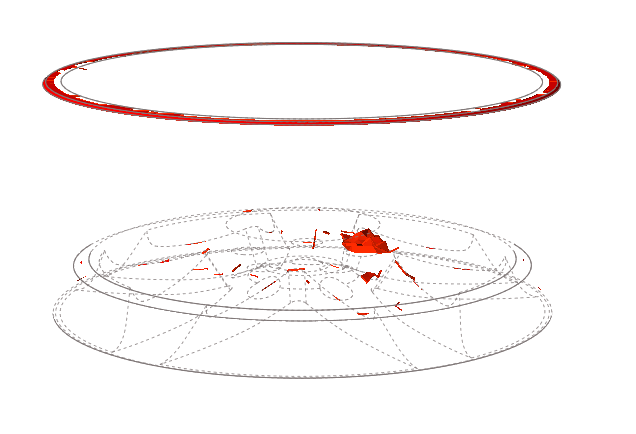
Click Cold Shuts under Result
Types.
This result is showing the temperature difference between the average of two fronts and the initial temperature (inlet temperature).