This example shows how to build a simple three-state pump. The pump operating states are defined as:
•Control OFF
•Control ON to pump water into the tank
•Control ON to pump water out of the tank
During simulation, the pump controls the water level in a tank by keeping the water within a specified minimum and maximum levels. An interactive ON/OFF button controls the pump. The tank drains completely if control is OFF, but it will never overflow.
To create a container for the 3-state pump
A state chart block is a container block inside which you define the operating modes of the pump.
1. Open a new diagram.
2. Choose State Charts > state chart to create a container for the state chart.
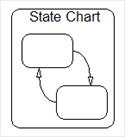
3. Click anywhere in the work area to place the state chart block. You will see the following:

4. Right-click the state chart block to enter the state chart design environment.