Visualization of the mesh elements
Introduction
The mesh elements and the mesh faults are stored in the data tree. They are not directly visible in the graphic zone because:
- there are too many
- only certain elements are desired when visualizing
Interest
In 2D, the user may want to visualize the faulty elements.
In 3D, the user may want to visualize:
- the faulty elements
- the pyramidal elements (constituted at the limit of a meshed domain by an automatic mesh generator and of a domain meshed by an adjusted mesh generator)
Adding to visualization
To add an element or a mesh fault to the visualization in the graphic zone:
| Stage | Action |
|---|---|
| 1 | Activate the Add to visualization command |
| → | The selection box is opened. |
| 2 |
Complete the selection box:
|
| → | The elements or the mesh faults appear in the data tree |
| → | The elements or the mesh faults appear in the graphic zone |
Example
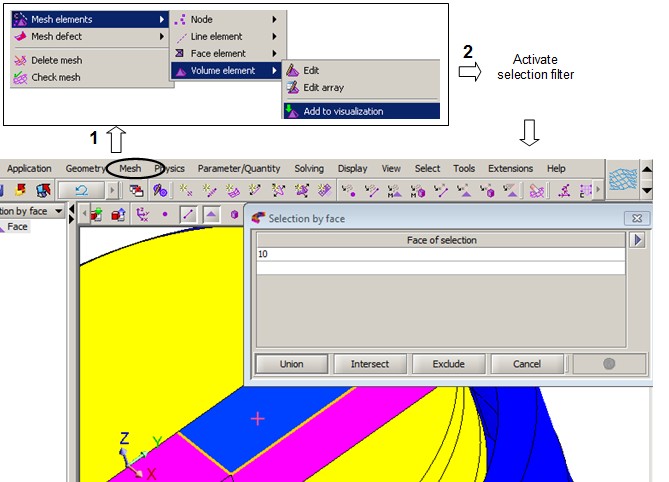
The figure describes the manner of activating the command Add to visualization, which requires data selection:
In this example, it is wished to display the pyramidal elements on face 10 meshed by means of an adjusted mesh generator in contact with the air region, meshed by an automatic mesh generator.
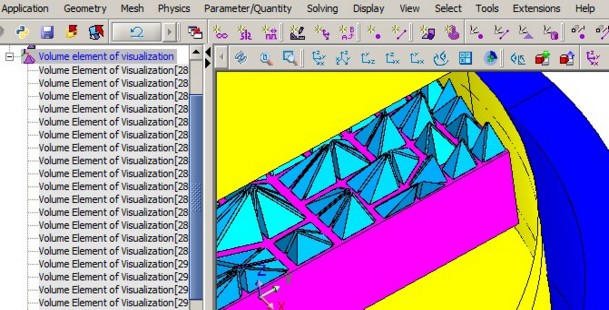
Result
The pyramidal elements located in face 10 and in contact with the meshed air region appear in the data tree and in the graphic zone.