Results of iron losses computation on regions
Computation results
The computation of iron losses on regions gives the following results
Curve
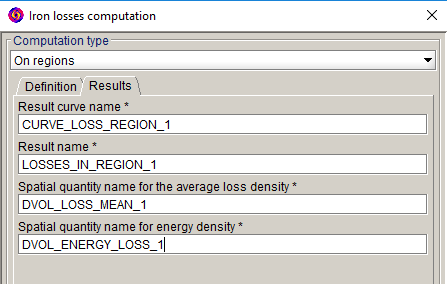
"CURVE_LOSS_REGION_i" curve can be displayed automatically and is stored in the tree in the area .
It represents instantaneous losses on the region(s) versus time.
Result
The results are automatically displayed in the data tree in the area .
The results include:
- Average losses over a period on region(s) (in W)
- Iron losses energy on region(s) (in J)
Spatial quantities
Spatial quantities, denominated "DVOL_ENERGY_LOSS_i" and "DVOL_LOSS_MEAN_ i" are stored in the data tree in the area
Spatial quantities correspond to:
- Average loss density “DVOL_LOSS_MEAN_i”
- Losses energy density "DVOL_ENERGY_LOSS_i"
Display loss density (isovalues)
It is possible to display the above mentioned spatial quantities in a color shade graphic (isovalues).
For this:
-
In Graphic menu:
Point on Isovalues and click on New
- In the box:
- Choose a support (laminated regions for iron losses computation)
- In the spatial quantities area, open the formula editor... (click on f())
-
In the Editor of formula and spatial quantities box / User tab, select one of the following spatial quantities:
- DVOL_LOSS_MEAN_i
- DVOL_ENERGY_LOSS_i
- Confirm by clicking OK
Isovalues are computed and displayed on the selected support in the graphic windows.