From the Section Cut panel, apply a section cut to the model.
Go to the Contour Plot panel.
From the Result type drop-down menu, select the data type that should be used
to calculate the contours.
Select the data component from the second drop-down menu below Result
type.
If there are several sections displayed and you only want to contour just one
section, select Elements for Selection and pick one or
more elements on the cross section of the model. Or, if you want to contour all
of the sections displayed, click Apply.
Activate the relevant check boxes for Display options, Legend threshold and
Result display control.
Click Apply.
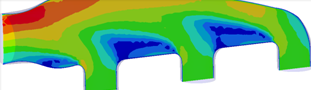
The contour settings are applied to the cross section of the model. Figure 1.
Use the Graphical Manipulator to modify the definition of section cuts, as well
as translate or rotate sections anywhere in 3D space.
Note: The graphical manipulator is linked to the entity display, therefore if a
section cut is not displayed, the display of the graphical manipulator is
also turned off. Right-click and select Show
Manipulator to display the graphical manipulator in the
graphics area.