Modify Curves
Modify a plot's curve data.
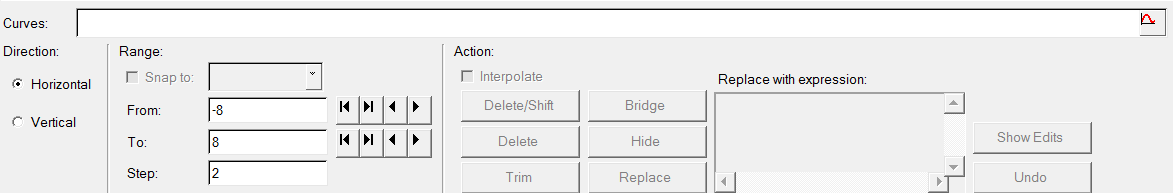
Figure 1.
Curves can be deleted, trimmed, bridged, or hidden within a specified range and orientation.
Modified vectors are changed to type values.
- Direction
- Select Horizontal or Vertical to set the range marker orientation and update the range bars in the plot window.
- Range
- Specify the range within which to edit the curve data.
- Action
-
- If Interpolate is selected:
- A point is inserted using the From or To values and performs the action.
- If Interpolate is deselected:
- The closest point is found for the selected curves based on the From/To values and performs the action.
- Delete/Shift
- Removes the data within the selected range and closes any gap created by this action.
- Delete
- Removes the data within the selected range without closing any gaps created by this action. Delete can only be used at the beginning or end of the curve.
- Trim
- Removes the data outside of the selected range.
- Bridge
- Bridges the curve linearly across the selected range. This replaces the data in the selected range with a straight line on a point by point basis.
- Hide
- Turns off curve points within the selected range, but does not remove any gaps created by this action.
- Replace
- Enter an expression in the Replace with Expression text box and use x and y as variables for the selected range. Click Replace to replace the points in the selected range with the expression.
- Replace with expression
- You can also replace curve points (on a point by point basis) within a specified range with an expression.
- Show Edits
- Displays all edits that the selected curves have in common. Edits can be renamed or deleted. You can undo the last edit performed. By default, the edit is named using the parameters, action, and range. For example, if you selected a horizontal parameter and cut a curve within the range 1-4, the default edit name would be: HORIZ_CUT1-4.
- Undo
- Click Undo after performing an edit to restore the curve to its previous state.