Curve Attributes
Define attributes such as line style, color, and weight, as well as symbol style and color.
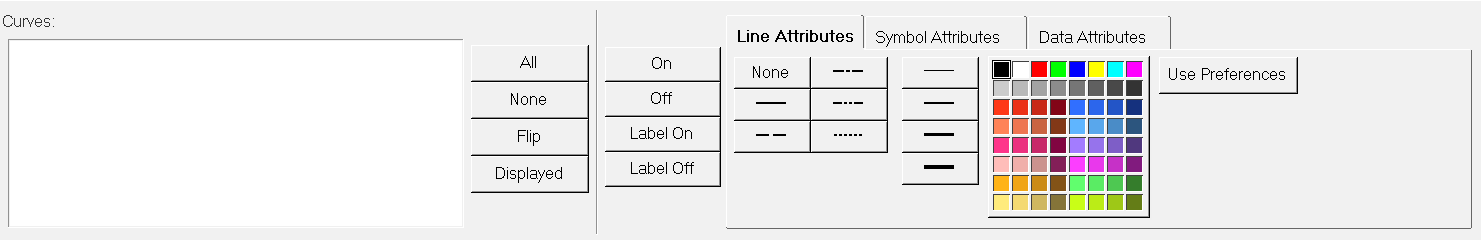
Figure 1.
Curves List
The curves list displays the names of the curves in the current window. To change the attributes of a curve, it must first be selected either from the curve list or picked from the window. Attributes can be assigned to more than one curve at a time by selecting multiple curves from the list or holding down the Ctrl key while picking curves from the window. Attributes are applied only to selected curves. Selected curves are highlighted in the list.
Use Preferences
Line and symbol attributes can be assigned automatically to selected curves using the Use Preferences feature.
When Use Preferences is selected from either Line Attributes or Symbol Attributes, the default attributes defined in your personal preferences file are automatically applied. If there is no preferences file available, the program’s built-in defaults are applied.
Line Attributes
Line styles can be assigned to curves to help differentiate different curves on a plot.
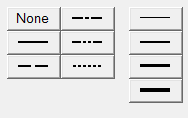
Figure 2.
Click on a line style to apply the style to the currently selected curves.
When None is assigned as a line style, the line is no longer displayed but the symbols assigned to the curve remain visible, creating a scatter plot of the curve. The curve is still displayed in the legend.
In addition to different line styles, line thickness can also be assigned to a curve. The line weight for each curve is displayed in the legend. Click on a line weight to change the thickness of the currently selected curves.
Any of the 64 colors can be assigned to a curve. Select a color from the color palette to change the color of the selected curves.
For Complex plots, select the Shade area under line option to fill in the are under the curve line with a solid color.
Symbol Attributes
Symbols can be placed on a curve to indicate data points.
There are nine different symbols available. To mark the data points on the currently selected curves, select a symbol from the symbol palette.
The frequency of the symbol placement is determined by the Every field. By default, Every is set to 1 so symbols are placed at every data point. To change the symbol frequency, enter a number in the Every field. For example, if Every is set to 5, a symbol is placed at every fifth data point on the curve.
Any of the 64 colors can be assigned to a symbol. Select a color from the Symbol Attributes color palette to change the color of the symbols on the selected curves.
Scatter plots can be created by setting the line style of a curve to None and then assigning a symbol to the curve.
Data Attributes
A data attribute is non-plottable data that can be associated with a curve or vector.
The table on the Data Attributes tab lists the attributes that you can apply to a curve or vector. An attribute may automatically be attached to vectors by external readers. The attributes in the table are those common to all selected curves. Press Tab or Enter to move between the table columns.
- Varname
- Unique variable name (with respect to the curve or vector) of the attribute. Two separate curves may have attributes with the same varname. A varname can contain underscores, but not spaces. If a varname is duplicated or contains a space, an error message is displayed.
- Label
- The descriptive label of the attribute. The label name can be the same as the varname. Label names can be duplicated or contain spaces.
- Type
- Drop-down menu that allows you to specify the type of attribute: integer, float, or string. The default type is integer.
- Attach To
- Drop-down menu that allows you to select if the attribute should be attached to the x vector, y vector, or curve. The default option is x vector.
- Value
- The value of the attribute (must match the Type).
Click Add to add an attribute to the table.
Click Delete to remove the selected attribute.
Click Apply to input the data attribute selection(s) made.
If there is no curve in the session, or a curve is not selected, these features are disabled.
The attributes can be used in expressions on the Modify Curves panel or in notes. Expressions or notes are automatically updated if the attribute value is changed. To reference an attribute, an extension is added to the standard pwc curve reference syntax.
For example, if the varname attribute_1 is attached to a curve, reference the varname as p1w1c1.attribute_1.
Attributes can be added to vectors from an external reader. If the attribute is attached to a vector, the varname follows the letter x or y, which follows the basic curve reference syntax.
For example, if the varname attribute_1 is attached to the x-vector, reference the attribute as p1w1c1.x.attribute_1.
If the varname attribute_1 is attached to the y-vector, reference the attribute as p1w1c1.y.attribute_1.