Datum Lines
Add horizontal and vertical datum lines to plots.
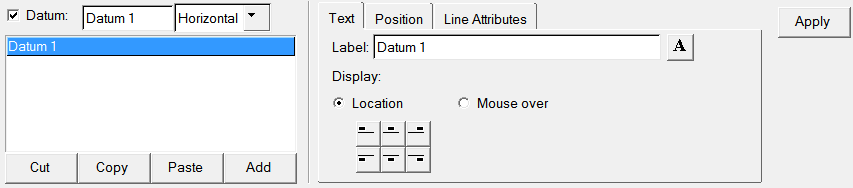
Figure 1.
A datum line can be hidden or displayed on a plot by activating the Datum check box.
You can specify a math expression to define the display of a datum line.
Use the drop-down menu next to the Datum check box to switch between horizontal and vertical datum lines.
Datum lines can be cut, copied, pasted, or added.
Text
- Label
- Create a label for a datum line.
- Font
- Select the font icon to change the font type, style, size.
- Display
- Under Display, select an icon that corresponds to the label location you want to set.
Position
Positions the datum line on the X or Y axis.
- Position
- Enter a value in the Position field.
- Axis
- Select the axis from the Axis menu.
-

- Positions the datum line to the maximum value of all visible curves.
-

- Positions the datum line to the minimum value of all visible curves.
Note: The Max/Min are only available for horizontal datum lines in the XY plot type. -
Line Attributes
Sets the attributes of a datum line.
Click Use Preferences to use the preferences set in the preferences.mvw file.