Curves View
The Curves view, ![]() , displays
the session's curves in the Plot Browser's tree structure,
grouped within their respective page and plot folders.
, displays
the session's curves in the Plot Browser's tree structure,
grouped within their respective page and plot folders.
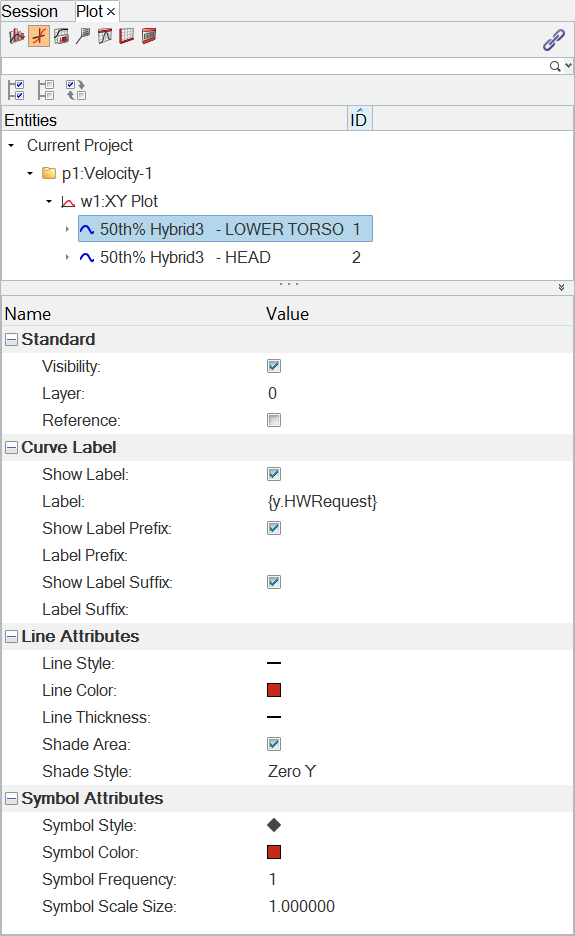
Figure 1.
To apply a filter on a curve or on an x or y vector property, right-click on the curve or x/y vector’s property in the Entity Editor and select Add as filter.
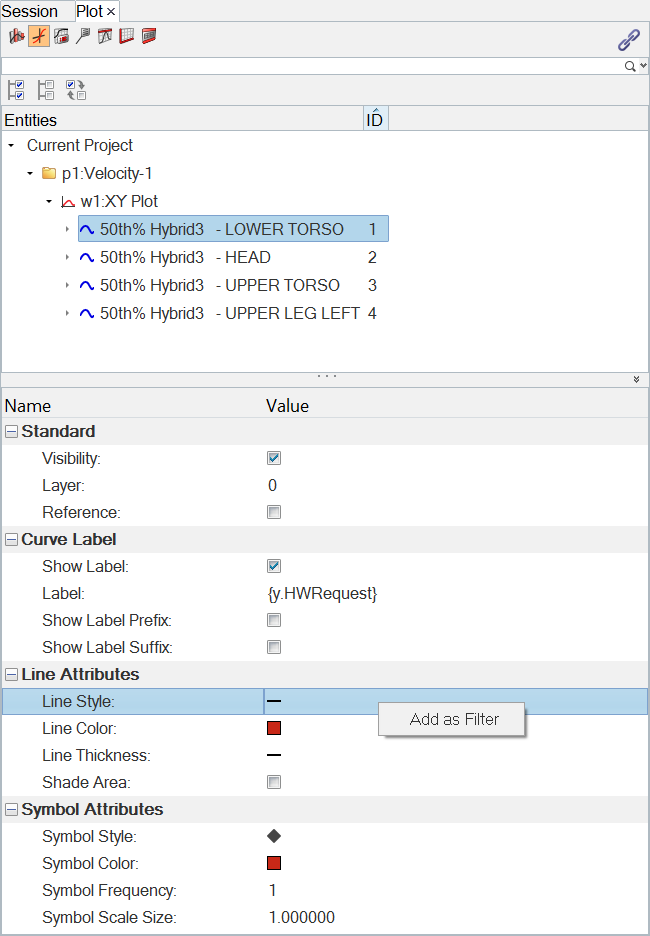
Figure 2.
All text fields which support Templex have now two add filter options, Add as Filter and Add as unevaluated Filter. This allows you to add the unevaluated Templex code as a filter.
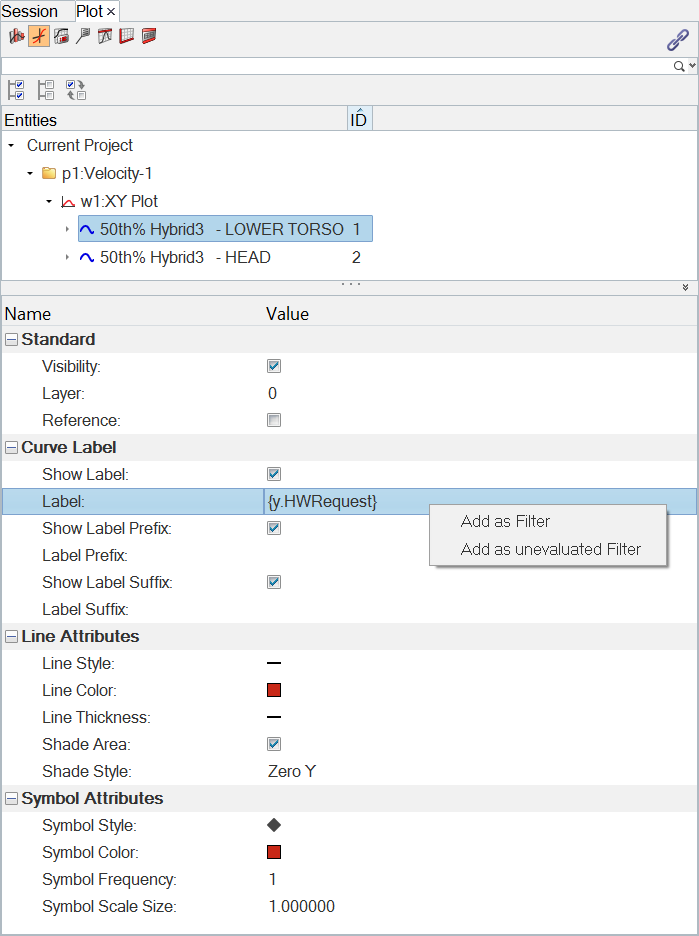
Figure 3.
After a value is given to that filter, all curves or vectors with that value for that property are shown in the browser. Vectors are displayed with their corresponding curves. See Plot Browser Filter for more information.
Vectors are shown in the Plot Browser tree as items under their corresponding curves. Clicking on a curve displays the curve's properties in the Entity Editor; clicking on a vector displays the vector's properties in the Entity Editor.
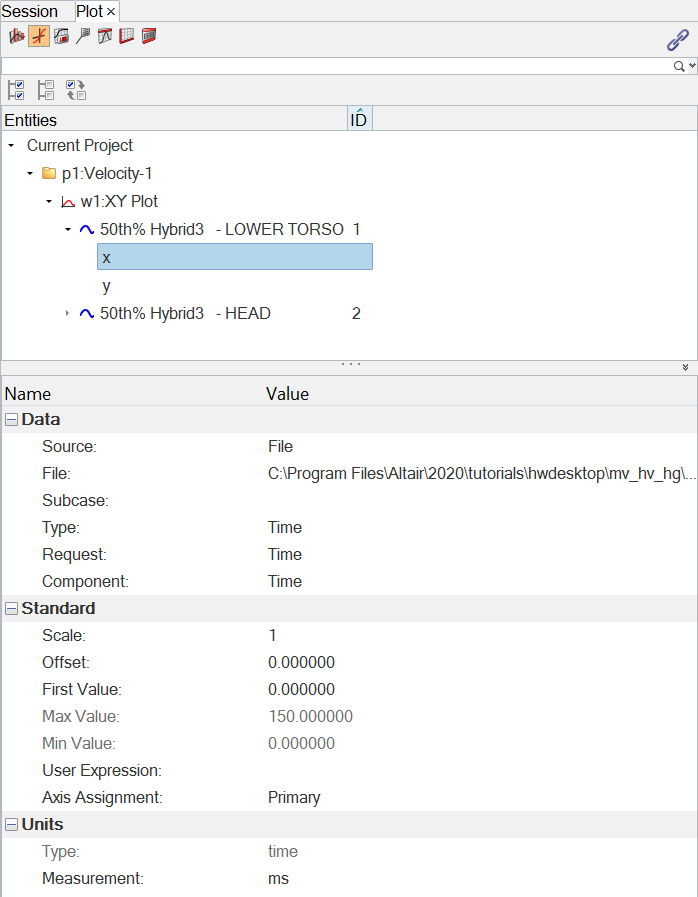
Figure 4. Entity Editor when File is selected as the data source
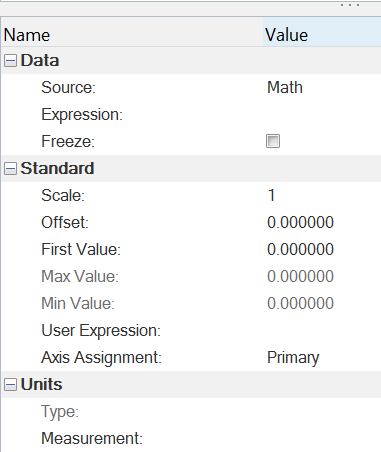
Figure 5. The Entity Editor options change when the Math or Values options are selected as the data source
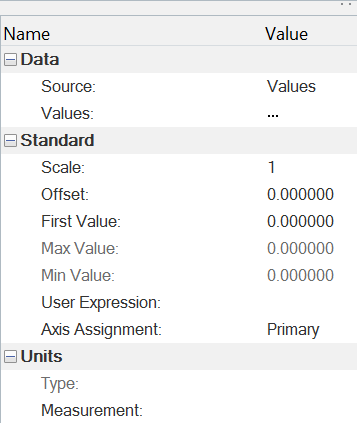
Figure 6.
The following curve and vector (entity type) properties are visible and editable through the Entity Editor.
Curve Properties
- Standard
-
- Visibility
- Turns on/off the curve display in the modeling window.
- Layer
- Bar View Style
- For bar plots, select Bar or Line to define how the bar plot is displayed.
- Reference
- Makes the selected curve(s) a reference curve(s). See Reference Curve for more information.
- Curve Label
-
- Show Label
- Displays the curve's label in the modeling window legend.
- Label
- When selected, the values are displayed in the legend as a label. Label prefix and Label suffix are updated with new options, and .
- Show Label Prefix/Show Label Suffix
- Curve prefix and suffix shortcuts in a Templex expression are supported from the entity editor. For example, if a note is attached to a curve, it can access suffix and prefix information using a Templex expression like {p1w1c1.suffix} and {p1w1c1.prefix}.
- Line Attributes
-
- Line Style
- Select a line style from the menu to apply to the selected curve.
- Line Color
- Select a curve color from the color palette.
- Line Thickness
- Select a line thickness for the curve from the menu.
- Shade Area
- Fills the area under the curve with a solid color.
- Shade Style
- If Shade Area is selected,
Shade Style is displayed. Select
from the following options:
- Zero X
- Zero Y
- Left
- Right
- Top
- Bottom
- Inside
- Bar Attributes
-
- Bar Color
- Select a bar color from the color palette.
- Bar Fill Style
- Fill the bar with the selected pattern.
- Symbol Attributes
-
- Symbol Style
- Symbols can be placed on a curve to indicate data points. Select a symbol type from the list.
- Symbol Color
- Select a symbol color from the color palette.
- Symbol Frequency
- Set the frequency of the symbol placement. Default is 1, where a symbol is placed at every data point. If you enter 5, a symbol is placed at every fifth data point, for example.
- Symbol Scale Size
- The symbol size.
Axis Attributes
- Value Axis
- For bar plots only. Select the value axis from the drop-down menu.
Vector (Entity Type) Properties
- Data
-
- Source
- The source type: File, Math, or Values.
- File
- If Source is File, the file path is displayed.
- Expression
- If Source is Math, the math expression is displayed.
- Values
- If Source is Values, the vector data values are displayed.
- Subcase
- Displays the subcase.
- Type/Request/Component
- Displays the type, request, and component data for the vector.
-
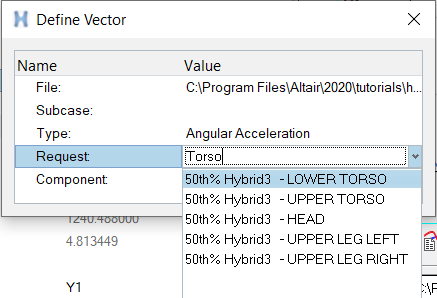
Figure 7.
- Standard
-
- Scale
- Select 1 or -1 as the scale value for the curve.
- Offset
- Enter an offset value.
- First Value
- The first data point of the vector.
- Max Value
- Maximum vector value.
- Min Value
- Minimum vector value.
- User Expression
- Axis Assignment
- The curve the axis is associated with.
- Units
-
- Type
- The unit type.
- Measurement
- Change curve vector units from the Measurement menu.
You can also select a curve from the Plot Browser and delete it by pressing the Delete keyboard key.
From the Scale drop-down menu in the entity editor, the values 1 and -1 are the only options allowed for vector scaling if units are enabled.
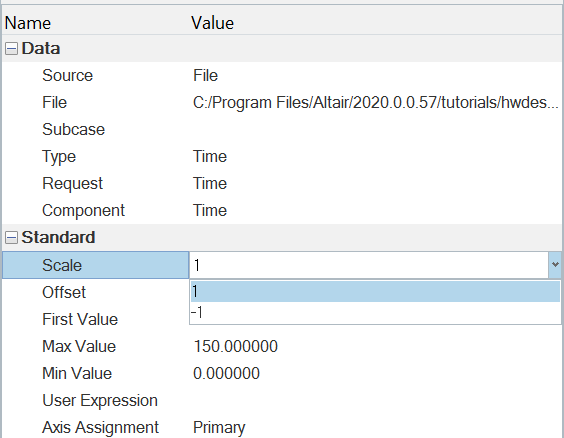
Figure 8.