Axes View
The Axes view, ![]() ,
displays only the axes in the session, grouped within their respective page and plot
folders. Click on an axis to display its properties in the Entity Editor.
,
displays only the axes in the session, grouped within their respective page and plot
folders. Click on an axis to display its properties in the Entity Editor.
See Axes for more information on defining a plot's axis.
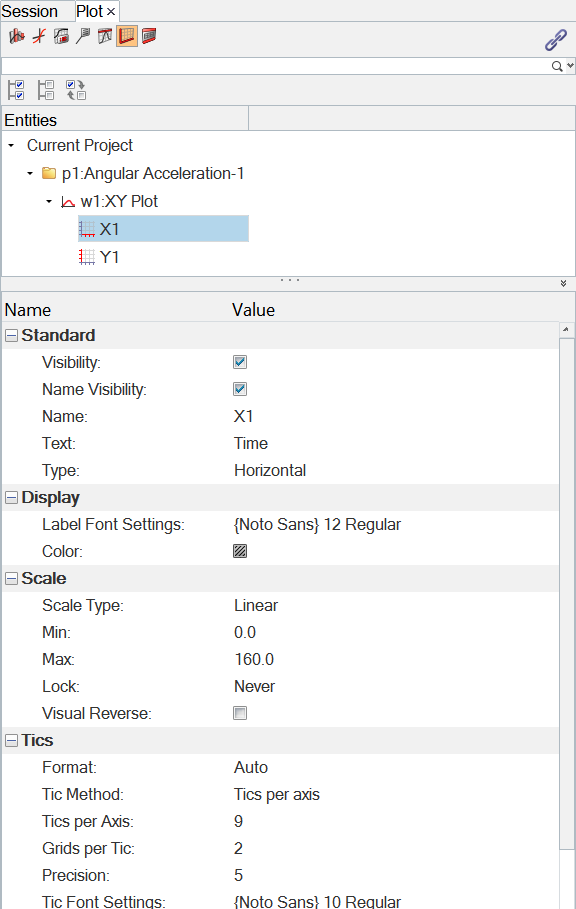
Figure 1.
When an axis is selected, the following fields are displayed in the Entity Editor:
Standard
- Visibility
- Turns on/off the axis display in the modeling window.
- Name Visibility
- Turns on/off the axis name in the modeling window.
- Name
- The axis name.
- Text
- The axis label.
- Type
- The axis type, horizontal or vertical.
Display
- Label Font Settings
- Font settings and color.
- Color
- Click the color box to select a color for the axis information.
Scale
- Scale Type
- From the drop-down menu, select linear, logarithmic, dB20, or dB10.
- Octave Plot Type
- Plot an octave curve using one of two modes: Linear or Step.
-
- Linear
- The curve is drawn as shown below:
-
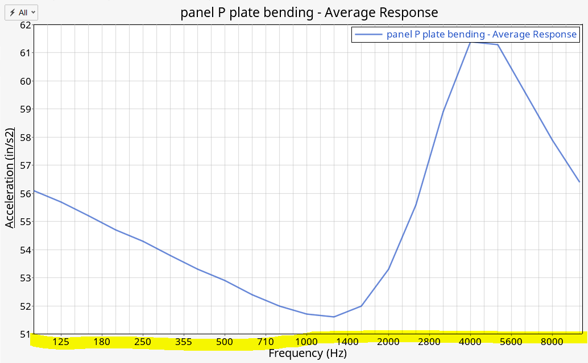
Figure 2. - Step
- The curve is displayed as steps, which looks like an outline of bar diagram as shown below:
-
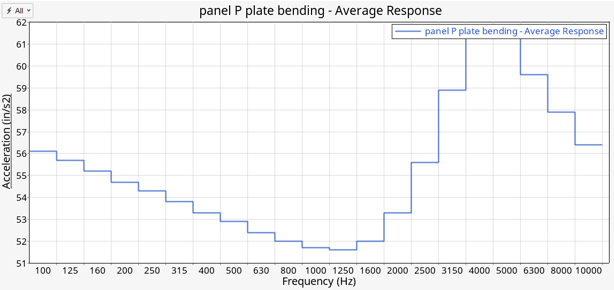
Figure 3.
-
- From the Plot Browser/Curves view, select the curve.
- Right-click and select Add Stackmath Operation.
- From the Add Stackmath Operation dialog, select octave.
- Define the parameters.
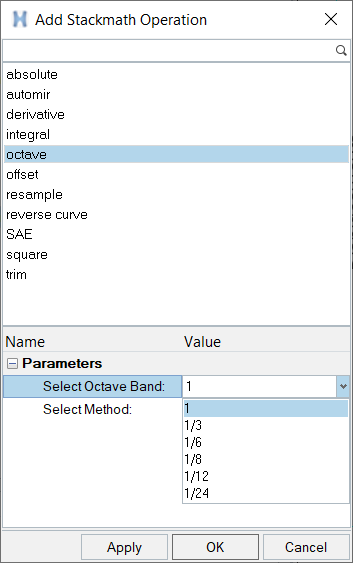
Figure 4.
- Min/Max
- The minimum and maxium values on this axis.
- Lock
- Select Never, At Import, or Always.
- Visual Reverse
- Visual Reverse – Activate Visual Reverse to
switch the values and reverse the axis display. You can either select
the axis from the browser, then activate Visual Reverse, or activate the
Toggle Sync Mode, select the axis from the GUI, and then activate the
option.Note: If Visual Reverse is activated and you attempt to drag the borders to trim a curve in the Modify Curves panel, it will not work. You will have to manually enter the new values in the From and To fields under Range.
Tics
- Format
- See the Scaling Axes and Axis Tics sections in the Axes topic for more information on the features in the Tic section.
- Tic Method
- Select Tics per Axis to add a specific number of tics. Select Tics per Increment to add tics at specific intervals.
- Grids per Tic
- If using the linear axis, use Grids per Tic (or grids per decade if the axis is logarithmic, decibels, or dB10) to change the number of grid lines on the graph.
- Precision
- Precision specifies the number of digits displayed to the right of the decimal point.
- Tic Font Settings
- Click to define the tic font settings.
Units
- Type
- The unit type.
- Measurement
- Select a unit of measure.