Exercise 1: Filter a Curve from the Define Curves Panel

Open Session File saefilter.mvw

  1. From the File menu, click Open > Session.
  2. From the plotting folder, select the saefilter.mvw file and click Open.

Filter a curve using the SAE J211/1 filter.

  1. Click on the Define Curves panel icon, .
  2. Click Add and add a new curve.
  3. Change the name of the new curve from Curve 1 to SAE J211/1 FILTER in the text box over the curve list.
  4. Check the radio button for Math under Source:.
  5. Verify that the x vector is active.
  6. Hold the Shift key and click on the curve in the plot window.
    The x = curve reference is p1w1c1.x.
  7. Click the y = field, and click Filter… from the panel menu to display the Filter dialog.
  8. Select the filter class SAE J211/1 from the Filter Class drop-down menu.
  9. Select Filter Class: 60, Padding: Mirror padding, and Direction: Fwd-Back.
  10. Click OK to complete the selection and close the Filter dialog.
  11. Hold down the Shift + Shift keys, then select the existing curve.
  12. The x vector curve reference is entered in the saefilt95 function.
  13. Hold down the Shift key and select the curve again.
    Note: The curve's y vector is referenced in the saefilt95 function. The y = field should read: saefilt95(p1w1c1.x,p1w1c1.y,60,1,3).
  14. Click Apply to create the filtered curve.
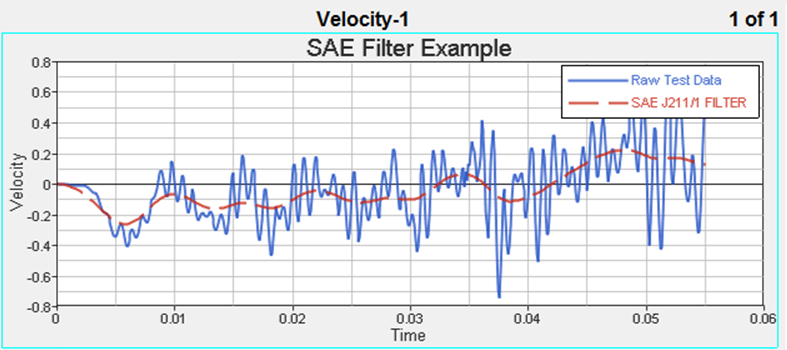
    Figure 1.