HS-2200: Use Existing Design Data from an Excel Spreadsheet
In this tutorial, you will learn how to build a predictive model (Fit) for an application where only design data in a Microsoft Excel spreadsheet is available (that is, no simulation model exists).
Before you begin, copy the model files used in
this tutorial from <hst.zip>/HS-2200/ to your working
directory.
The objective of this tutorial is to create a Fit (approximation) using the designs in the spreadsheet.
The spreadsheet used here contains five columns. The first column contains the numbering of the designs, the second and third columns contain the values of the two input variables for each design, and the fourth and the fifth columns contain the results of a DOE study previously run. Sixteen designs have been evaluated.
Perform the Study Setup
- Start HyperStudy.
-
Start a new study in the following ways:
- From the menu bar, click .
- On the ribbon, click
 .
.
- In the Add Study dialog, enter a study name, select a location for the study, and click OK.
- Go to the Define Models step.
-
Add an Internal Math model.
- Click Add Model.
- In the Add dialog, add one Internal Math model.
- Go to the Define Input Variables step.
-
Add input variables.
- Optional:
Copy the input variable labels from the study.xls
spreadsheet, and paste them into the Labels
column of the work area.
Note: When you paste the input variable labels into the work area, select Paste transpose from the context menu.
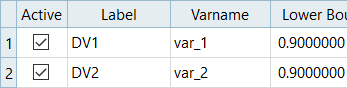
Figure 1.
- Optional:
Copy the input variable labels from the study.xls
spreadsheet, and paste them into the Labels
column of the work area.
Perform Nominal Run
Create and Evaluate Output Responses
- Optional:
Copy the output response labels from the study.xls
spreadsheet, and paste them into the Label column in the work area.
Note: When you paste the input variable labels into the work area, select Paste transpose from the context menu.
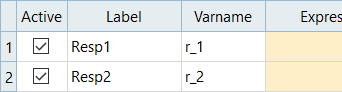
Figure 2.
Run DOE
-
Add a DOE.
- In the Explorer, right-click and select Add from the context menu.
- In the Add dialog, select DOE and click OK.
- Go to the step.
- In the work area, set the Mode to None.
- Click Apply.
-
Edit run matrix.
-
In the top, right of the work area, select .
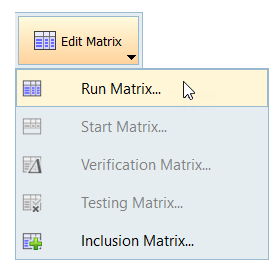
Figure 3. -
Copy all of the input variable and output response data for each run in
the spreadsheet.
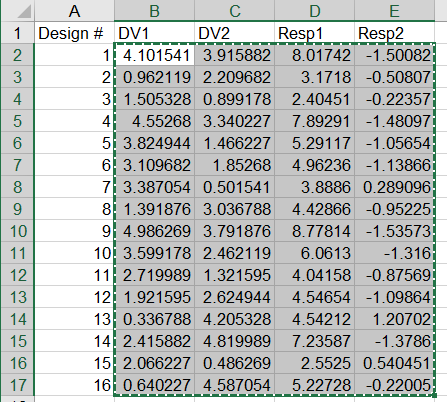
Figure 4. -
Right-click on the highlighted runs, and select
Paste from the context menu.
HyperStudy pastes the input variable and output response data that you copied from the study.xls spreadsheet into the run matrix.
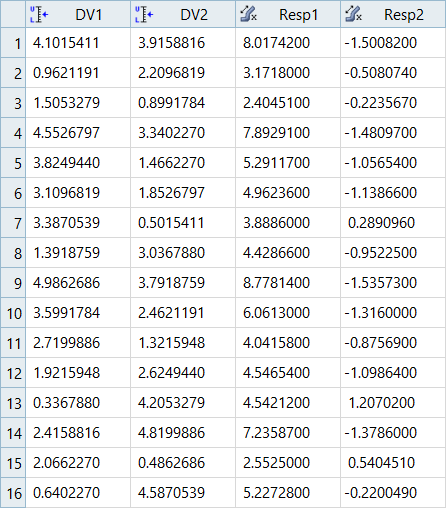
Figure 5.
-
In the top, right of the work area, select .
Run Fit
-
Import matrix.
- Go to the step.
- Click Add Matrix.
- Click Import Matrix.

Figure 6. -
Click the Residuals tab to investigate the accuracy of
your approximation. From the table you can see that this approximation is not as
good.
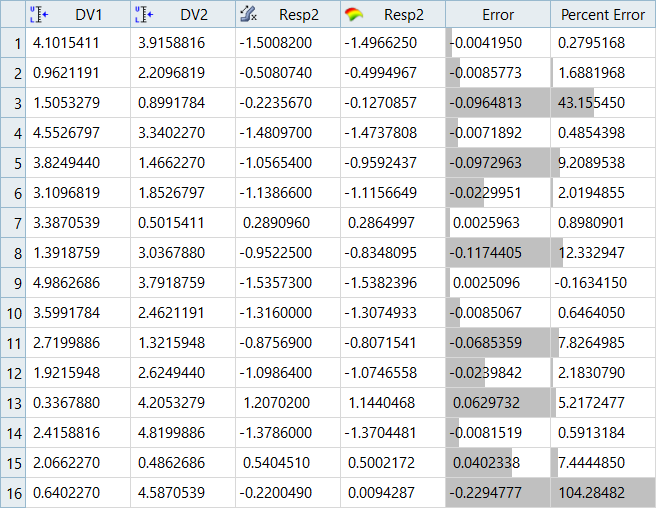
Figure 7.