*SetCurveDefaults()
Specifies default curve attributes such as line style, symbol style, and color.
Syntax
*SetCurveDefaults (Line Style, Line Color, Line Weight, Symbol Style, Symbol Color)
Application
HyperGraph and HyperStudy.
Inputs
- Line Style
- A number between 0 and 5 that specifies a line style for the curve.
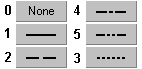
Figure 1. - Line Color
- A number from 0 to 63 representing any of the 64 colors on the palette.
- Line Weight
- A number between 0 and 3 that specifies the line weight.

Figure 2. - Symbol Style
- An integer between 0 and 9 specifying the symbol to display on the curve.
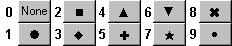
Figure 3. - Symbol Color
- An integer between 0 to 63 representing any of the 64 colors on the palette.
Context
*BeginPlotDefaults()
Example
• • •
*BeginPlotDefaults()
	*SetBorderColor(12)
	*SetFrameColor(12)
	*SetHeaderColor(1)
	*SetBackgroundColor(0)
	*SetGridlineColor(14)
	*SetZerolineColor(10)
	*SetAxisColor(1)
	*SetCurveDefaults(1, 3, 1, 0, 0)
	*SetCurveDefaults(1, 4, 1, 0, 0)
	*SetAxisDefaults(0, 11, 2, 1, 11, 4)
	*SetLegendPlacement(TopRight)
	*SetNoteAttachment(View)
	*SetNoteAlignment(Left)
	*SetNoteFont("Helvetica",1,1,24)
	*SetPrintLineThickness(0.5)
	*SetLegendFont("Helvetica",1,1,24)
	*SetAnimBubbleColor(6)
*EndPlotDefaults()
• • •
Comments
A plot preference block can contain several *SetCurveDefaults() statements. The program assigns curve attributes sequentially. The first *SetCurveDefaults() in the preferences file is applied to the first curve, the second to the second curve, and so on until the last *SetCurveDefaults() statement is reached. The attributes repeat from the beginning if there are more curves than *SetCurveDefaults() statements.
Any argument after Line Style can be left blank.