OS-V: 0531 Laminated Shell Strength Analysis Mechanical Load 1
This problem analyzes the strength of laminated composite shells when subjected to a uniform longitudinal load per unit length.
The model and boundary conditions are described by Hopkins (2005). The resulting ply failure indices are compared against analytical solutions from classical lamination theory (CLT). The results indicate good agreement between OptiStruct and CLT.
Benchmark Model
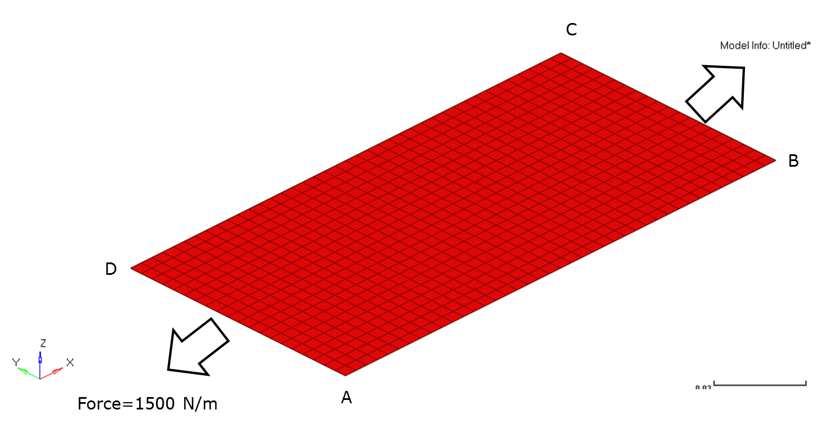
Figure 1. Composite Laminate Shell Subjected to Uniform Tensile Load. arrowheads represent applied load
800 mesh elements of CQUAD4 element type were used in this study. The model is fixed at the point A using a SPC card and a uniform longitudinal load per unit length (Nx) of 1500 N/m is applied along edges A-D and B-C using FORCE card.
- Property
- Value
- Longitudinal Young’s Modulus, El (GPa)
- 207.0
- Transverse Young’s Modulus, Et (GPa)
- 7.6
- Longitudinal Shear Modulus, Glt (GPa)
- 5.0
- Major Poisson’s ratio, 12
- 0.3
- Longitudinal Tensile Strength, lt (MPa)
- 500.0
- Longitudinal Compressive Strength, lc (MPa)
- 350.0
- Transverse Tensile Strength, tt (MPa)
- 5.0
- Transverse Compressive Strength, tc (MPa)
- 75.0
- In-plane shear strength, lt (MPa)
- 35.0
| Ply | Orientation (°) | Thickness ( m) |
|---|---|---|
| 1 | 90.0 | 0.05 |
| 2 | -45.0 | 0.05 |
| 3 | 45.0 | 0.05 |
| 4 | 0.0 | 0.05 |
- Dimension
- Value
- Length (m)
- 0.2
- Breadth (m)
- 0.1
Results
| Midplane Strains | Theory | OptiStruct Result |
|---|---|---|
| x | 3.176 x 10⁻⁴ | 3.176 x 10⁻⁴ |
| y | -1.447 x 10⁻⁴ | -1.447 x 10⁻⁴ |
| xy | 1.108 x 10⁻⁴ | 1.108 x 10⁻⁴ |
| Failure Criteria | Ply 1 | Ply 2 | Ply 3 | Ply 4 | ||||
|---|---|---|---|---|---|---|---|---|
| Theory | OptiStruct Result | Theory | OptiStruct Result | Theory | OptiStruct Result | Theory | OptiStruct Result | |
| Tsai-Wu | 0.88402 | 0.8841 | 0.37308 | 0.3731 | 0.01990 | 0.01991 | -0.34309 | -0.343 |
| Hill | 0.77952 | 0.77960 | 0.16323 | 0.16330 | 0.00435 | 0.00435 | 0.00136 | 0.00136 |
| Hoffman | 0.88110 | 0.88140 | 0.37630 | 0.37610 | 0.02004 | 0.02000 | -0.34534 | -0.34510 |
| Reserve Factor | Ply 1 | Ply 2 | Ply 3 | Ply 4 | ||||
|---|---|---|---|---|---|---|---|---|
| Theory | OptiStruct Result | Theory | OptiStruct Result | Theory | OptiStruct Result | Theory | OptiStruct Result | |
| Tsai-Wu | 1.1223 | 1.122 | 2.53671 | 2.537 | 14.304 | 14.3 | 31.879 | 31.89 |
| Hill | 1.1325 | 1.133 | 2.4748 | 2.475 | 15.157 | 15.16 | 27.124 | 27.12 |
| Hoffman | 1.1259 | 1.126 | 2.4944 | 2.494 | 14.101 | 14.1 | 37.869 | 37.88 |
Model Files
Refer to Access the Model Files to download the required model file(s).
- lssam1_tsai.fem
- lssam1_hill.fem
- lssam1_hoff.fem
Reference
NAFEMS R0092 - Benchmarks for membrane and bending analysis of laminated shells. Part 1, Stiffness matrix and thermal characteristics
NAFEMS R0093 - Benchmarks for membrane and bending analysis of laminated shells. Part 2, Strength analysis