Modify Scope Display
Modify the scope display through the scope window, block dialog and Property Editor.
Modify Scopes in the Window
Use the microdialog options to define a curve line, grid, and axis label in the plot window.
-
Choose to define the following:
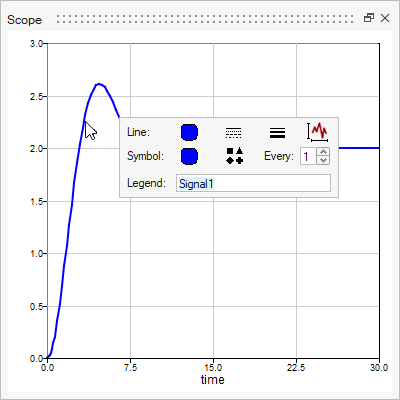
- Curve: Right-click the curve, then define the
parameters in the microdialog. Enter a label for the curve in the Legend
field.
 Note: If the legend is hidden, left-click a line, then select Legend Visibility in the Property Editor.
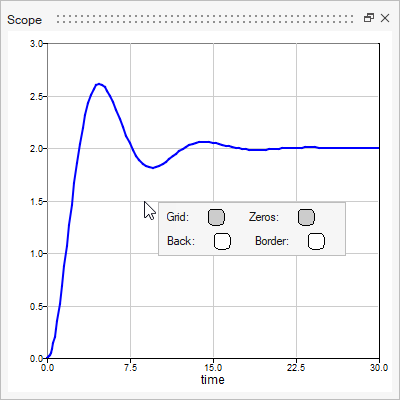
 - Grid: Right-click a grid line, then define the
grid parameters in the microdialog.
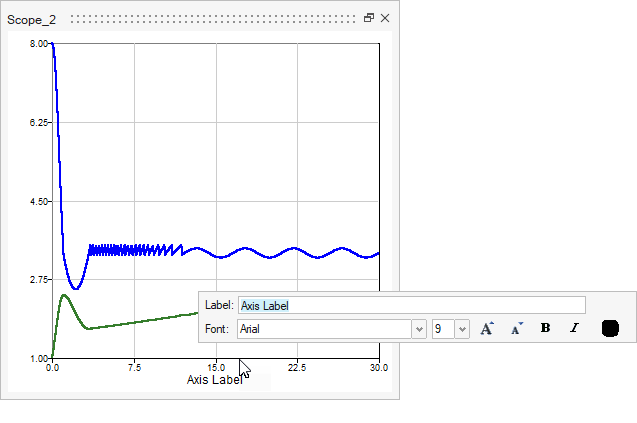
- Axis Label: Right-click the axis, then define the
axis label in the microdialog.
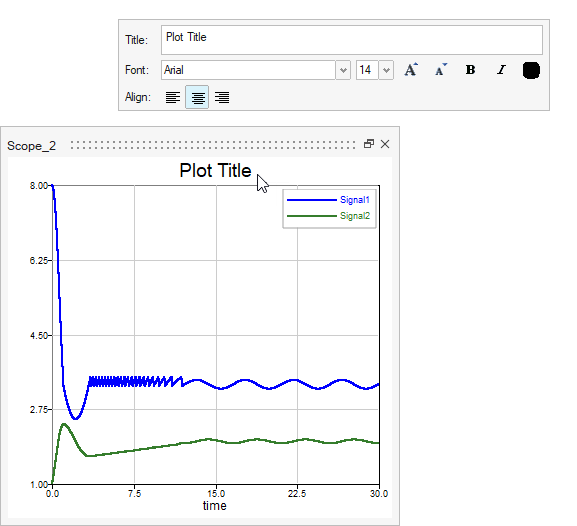
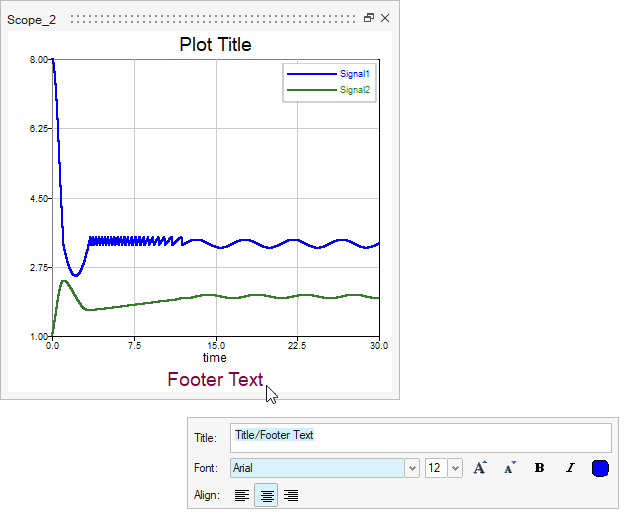
- Plot Header/Title: Right-click in the space above
the plot, then define the header text in the microdialog.
- Plot Footer: Right-click in the space below the
plot, then define the footer text in the microdialog.
- Curve: Right-click the curve, then define the
parameters in the microdialog. Enter a label for the curve in the Legend
field.
Modify Scope Parameters in the Block Dialog
Double-click a scope block in the model to edit parameters that dictate the scope behavior.
-
To change how plots are generated for the scope block, set the window options
in the block dialog:
-
Right-click a scope block in your model.

-
Select a Window option from the list:
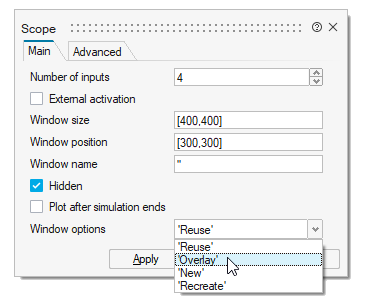
Option Description Overlay Display results from multiple runs in the same plot window. Reuse Generate results in the same window for multiple runs. Display the current results and delete the previous results. New Generate results in a new window for each run. Retain the existing window. Recreate Generate results in a new window for each run. Delete the existing window.
-
Right-click a scope block in your model.
- Click OK.
Modify Scopes in the Property Editor
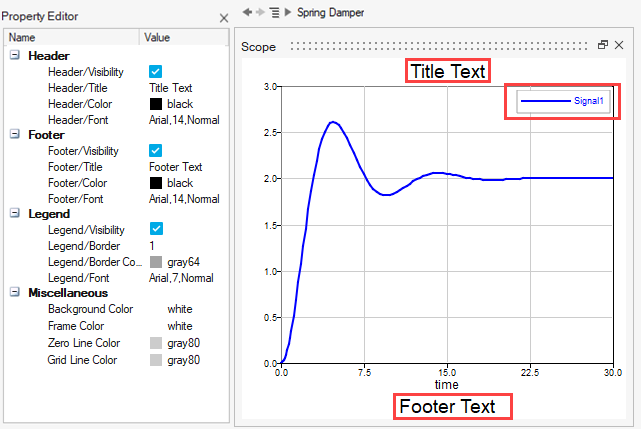
Use the Property Editor to modify the headers, footers, and display aspects of the scope window and legend.
-
Left-click the white space in the plot window.
The Property Editor displays the options available to define a Header, Footer, Legend display, and a number of visual properties.
Note: You must modify some items directly on the plot including
the axis label, legend name, and curve display by right-clicking the desired object
in the plot window and modifying it with the microdialog options.