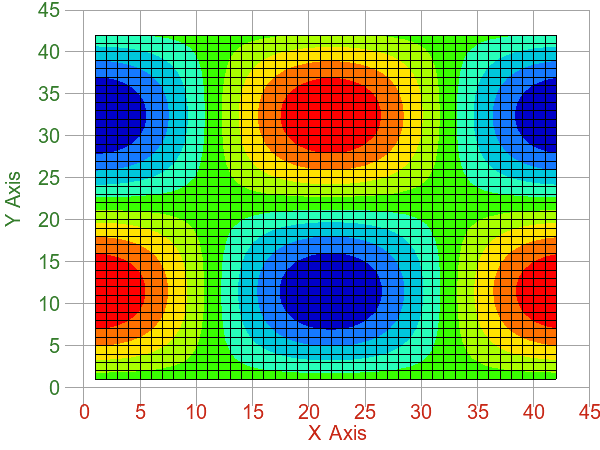
x = linspace(-2*pi,2*pi,50);
y = linspace(0,2*pi);
[X,Y] = meshgrid(x,y);
Z = sin(X).*cos(Y);
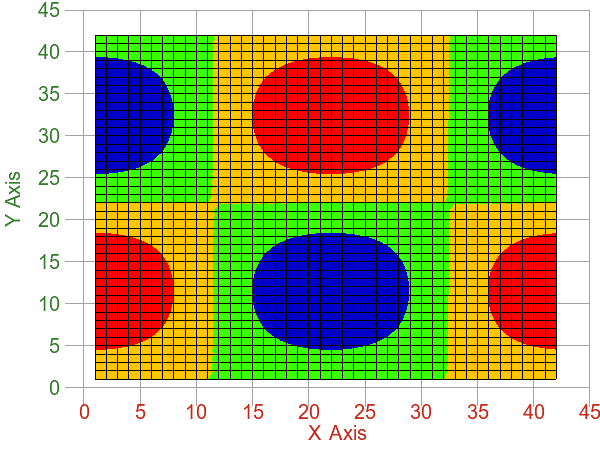
contour(x,y,Z);
Comments
If there are no axes, one will be created first. If x and
y are omitted, the index of the columns of z is used
for x coordinates and the index of the rows of z is used for y
coordinates. If the first argument of contour() is an axes handle,
surfaces will be created in that axes.