hold
Turn on/off the "hold" state of axes. When the "hold" state is on, new plotting data will be added to the axes.
Syntax
hold()
hold(hAxes)
hold(option)
hold(hAxes, option)
Inputs
- hAxes
- Handle of the axes to set hold on or off.
- option
- Takes one of the following values:
- 'on'
- Sets the hold state to 'on'. New plot commands will append data to the axes.
- 'off'
- Sets the hold state to 'off'. New plot commands will replace the existing plot.
Examples
hold example on active axes.
figure;
axes;
hold('on');
x = 1:0.1:10;
for ii=1:5
  plot(ii+x, cos(x));
end
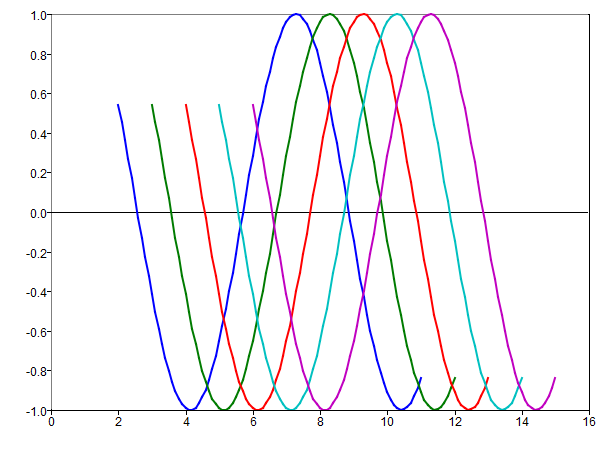 Figure 1. Set hold 'on' on active axes
hold example on axes.
figure;
x = 1:0.1:10;

subplot(2,1,1);
plot(x, cos(x));
ax1 = gca;

subplot(2,1,2);
plot(x, sin(x));
ax2 = gca;

hold(ax1, 'on')
plot(ax1, x, sin(x));
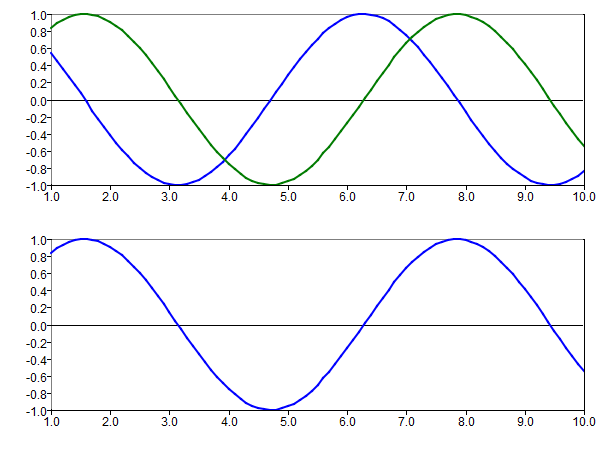 Figure 2. Set hold 'on' on axes
Comments
If hold is called without an option argument then the state will be toggled. If hold is called without an hAxes argument then the hold state of the active axes will be set.
Note that hold(hAxes) or hold(hAxes, option) will not change the active axes to hAxes (See also Example 2).